Configure profiler
Overview
osprofiler, the Cross-project profiling library for OpenStack, is integrated in Vitrage to generate 1 trace per request, that goes through all involved services.
Configuration
Profiling must be enabled explicitly in Vitrage configuration file:
[profiler]

enabled = true
hmac_keys = SECRET_KEY
#connection_string = messaging://
hmac_keywill be used in client to sign a request with profiling enabledconnection_stringspecify the storage driver to collect tracing data, default to ceilometer via messaging
Please refer to osprofiler user manual for details
Usage
Use --profile option in Vitrage CLI to send a request with profiling enabled, e.g.:
vitrage --profile SECRET_KEY topology show
The key must match the hmac_keys configured in the server.
The uuid of trace will be prepended to the result:
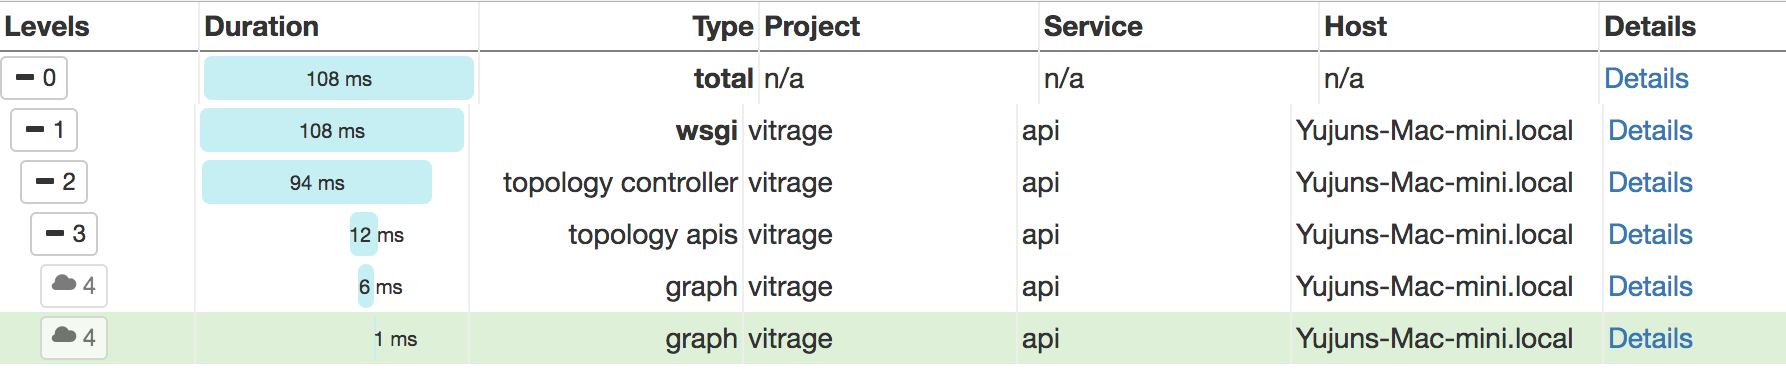
To display trace use the command:

  osprofiler trace show --html 8c2a594b-bb26-4a00-a408-fd378ae3566b

{
  "directed": true,
  "graph": {},
  "nodes": [],
  "links": [],
  "multigraph": true
}%
Follow the help message above to show the trace file with osprofiler client:
osprofiler trace show --html 8c2a594b-bb26-4a00-a408-fd378ae3566b

Except where otherwise noted, this document is licensed under Creative Commons Attribution 3.0 License. See all OpenStack Legal Documents.