Architecture diagram guidance
Types of diagrams required
This page provides guidance on architecture diagrams for threat analysis, a template for architecture documentation is available at <link>.
Two types of diagrams are required for threat analysis:
A service architecture diagram
One or more information flow diagrams (either data flow diagrams, sequence diagrams, or both)
Examples of each of these are given below. There are no firm diagramming toolchain requirements, but the tool used must be able to draw the diagrams discussed. It is generally preferable to use a text-based diagram generator so diagrams can be managed with gerrit. Some options for tools include:
draw.io (proprietary XML files, but very easy to use)
Google drawing (no XML/text output, but can be used collaboratively)
blockdiag (non-WYSIWYG with a steeper learning curve, suitable for very simple diagrams)
When drawing architecture diagrams, it may be beneficial to draw the diagram on paper or a whiteboard before attempting to draw it with a diagramming tool.
When you have completed the diagram, export both a text version (if available) and a Portable Network Graphic (.png) file to be committed to the repository with the architecture page.
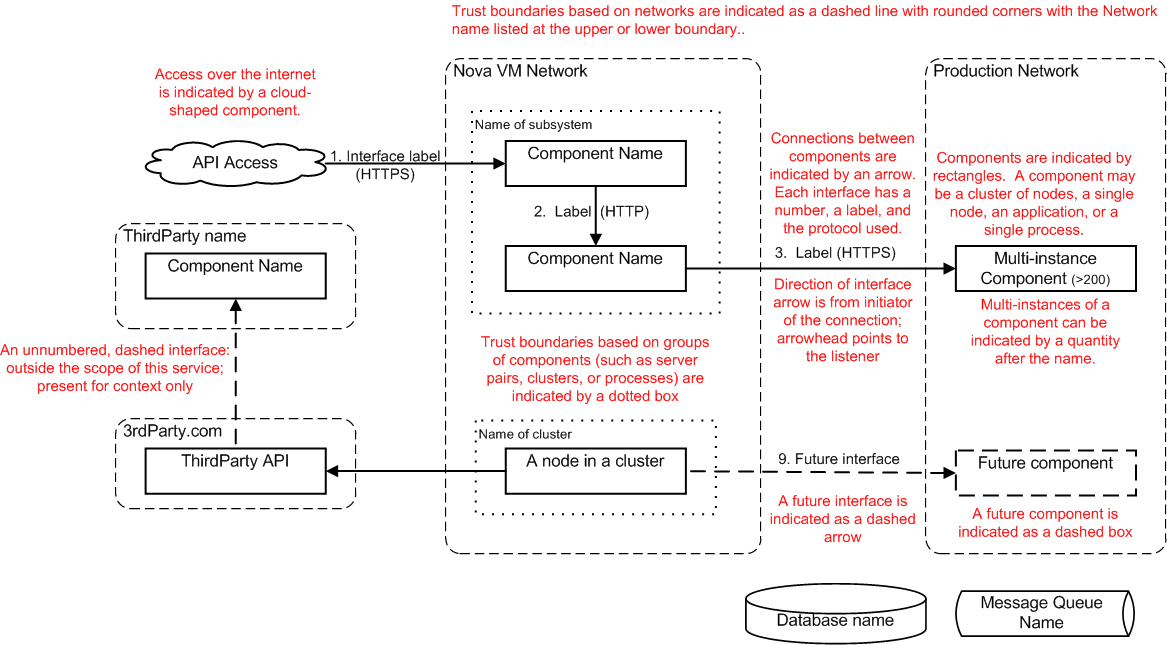
Service architecture diagram requirements
Service Architecture diagrams contain these elements:
Components
A rectangle containing a unique name is used to depict each component
Components may be servers, clusters, or individual processes
Standard component shapes should be used to illustrate component types
A vertical cylinder indicates storage or a database
A horizontal cylinder (a “pipe” shape) indicates a message queue (use an elongated rectangle if horizontal cylinders are unavailable)
A dashed rectangle indicates a future component
Multi-instances of a component should be indicated by a quantity after the component name, for example (100), and if possible layered component boxes
Component shapes don’t need to be all the same size. Some component shapes may be shrunk to allow application layers to be easily recognized, without creating a maze of crossed interface lines
User access over the internet can be indicated by a cloud-shaped component, but where multiple connections or external parties are connected via the internet, a separate internet trust domain should be shown
Interfaces
An arrow connecting two components is used to depict an interface
Each interface has a unique number and name; listing the network protocol (in parenthesis) is strongly recommended
Direction of interface arrow is from the component initiating the connection; the arrowhead points to the listening/receiving component
A future interface is indicated as a dashed arrow
Trust domains
Boundaries between trust domains must be shown
Trust boundaries based on networks are indicated as a dashed line (preferably with rounded corners), with the Network name listed at the upper or lower boundary
Trust boundaries based on groups of components (such as server pairs, clusters, processes, or collections of related components) are indicated by a dotted box
When a third party network boundary is used to illustrate a trust domain, use that third party’s name as the network boundary label
Service architecture diagram template
This template illustrates the elements of a service architecture diagram.
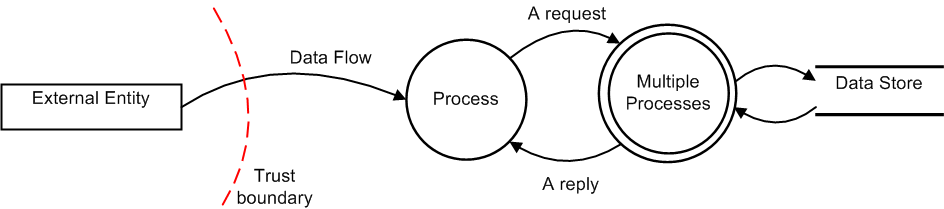
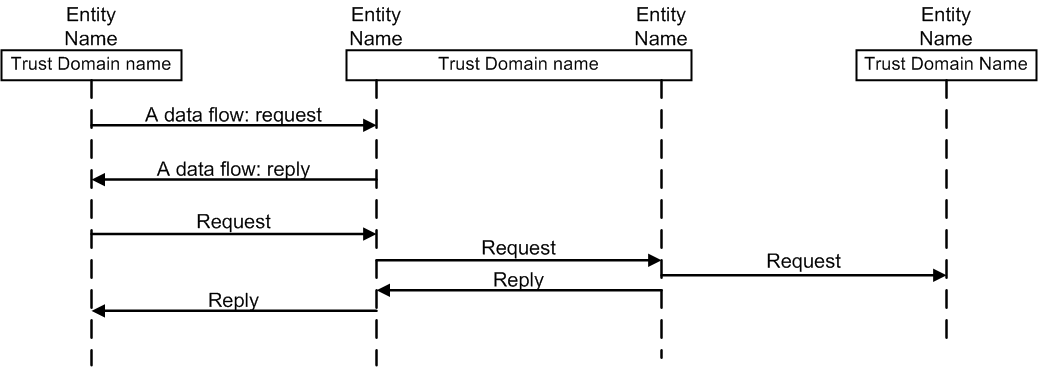
Information flow diagram requirements
Information flow diagrams depict the flow of data between entities to illustrate the steps in a process or procedure. Often, multiple diagrams are created to illustrate individual use cases.
Each information flow diagram must be in the form of either a data flow diagram (DFD) or a sequence diagram. The architect may select either type of diagram (or both) for illustrating information flows within the service.
Information flow diagrams contain the following elements:
Entities
An entity may be a single process, multiple processes within a trust domain, a data store, or an external entity.
Each entity has a unique name which should match a name on the architecture diagram
The number of entities on a flow diagram often matches the number of components on a service architecture diagram.
Data flows
Arrows indicate data flows between entities; the direction of the arrow indicates the direction of data movement
Any pair of entities may have multiple sets of arrows to illustrate a multi-step exchange of data between the entities
Typically every interface on a service architecture diagram has one or more corresponding data flows on a flow diagram
Trust boundaries
Groups of entities with the same level of privilege form a trust domain, the boundaries of which are indicated by a dashed line in DFDs and by a shallow rectangle on sequence diagrams
Optional supplementary information
Textual notes on the diagram can provide clarification on data types sent and received, changes in privilege, or steps forming a use case
Data flow diagram template
This template illustrates the elements of a data flow diagram.
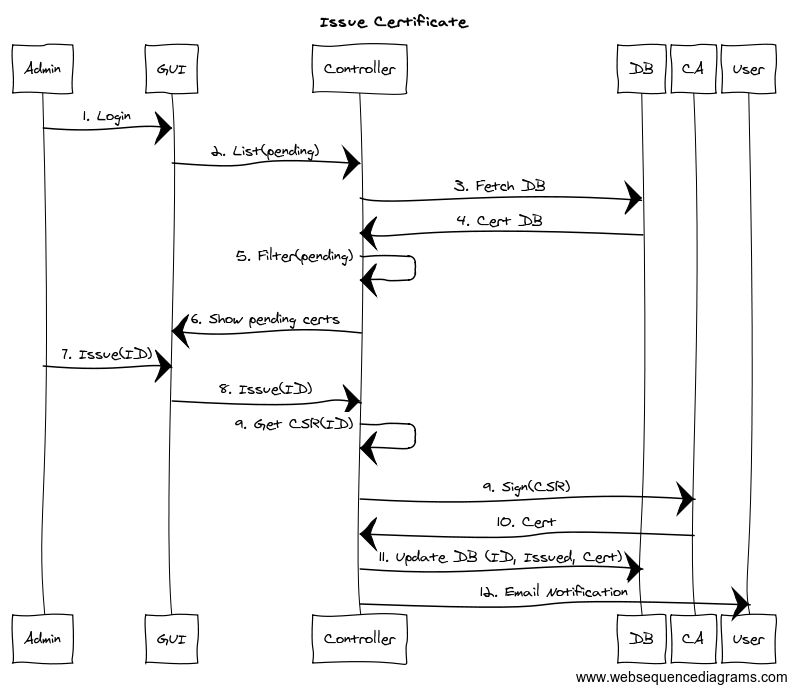
Sequence diagram template
The following template illustrates the elements of a sequence diagram.
Sequence diagrams can be quickly and easily generated from text using WebSequenceDiagrams . Enter a specification using a simple scripting language, as follows. Be sure to include authentication steps in your diagram.
title Issue Certificate
Admin->GUI: 1. Login
GUI->Controller: 2. List(pending)
Controller->DB: 3. Fetch DB
DB->Controller: 4. Cert DB
Controller->Controller: 5. Filter(pending)
Controller->GUI: 6. Show pending certs
Admin->GUI: 7. Issue(ID)
GUI->Controller: 8. Issue(ID)
Controller->Controller: 9. Get CSR(ID)
Controller->CA: 9. Sign(CSR)
CA->Controller: 10. Cert
Controller->DB: 11. Update DB (ID, Issued, Cert)
Controller->User: 12. Email Notification
The tool creates a sequence diagram as follows: