6.14.1. LMA Test Results
- Abstract
This document includes results of measuring how many resources LMA service needs as a monitoring service during using on a big environment (~200 nodes). This document includes results of reliability testing of LMA services.
6.14.1.1. Environment description
6.14.1.1.1. Hardware configuration of each server
role |
role |
OpenStackController |
OpenStackCompute and LMA |
CPU |
core_count (+HT) |
40 |
12 |
frequency_MHz |
2300 |
2100 |
|
RAM |
amount_MB |
262144 |
32768 |
Disk1 |
amount_GB |
111.8 |
75 |
SSD/HDD |
SSD |
SSD |
|
Disk2 |
amount_GB |
111.8 |
1000 |
SSD/HDD |
SSD |
HDD |
|
Disk3 |
amount_GB |
1800 |
|
SSD/HDD |
HDD |
||
Disk4 |
amount_GB |
1800 |
|
SSD/HDD |
HDD |
6.14.1.1.2. Software configuration of the services
6.14.1.1.2.1. Installation of OpenStack and LMA plugins:
OpenStack has been installed using Fuel version 8.0 and fuel plugins: 3 controllers, 193 computes (20 OSD), 3 Elasticsearch, 3 InfluxDB, 1 Nagios
Software |
Version |
|---|---|
Fuel |
8.0 |
fuel-plugin-lma-collector |
0.9 |
fuel-plugin-elasticsearch-kibana |
0.9 |
fuel-plugin-influxdb-grafana |
0.9 |
6.14.1.2. Testing process
Fuel 8.0, LMA plugins and OpenStack have been installed installed.
Rally tests have been performed two times. Results are here:
rally_report_1.htmlrally_report_2.htmlMetrics (cpu, memory, I/O) have been collected using collectd
Disbale InfluxDB services in haproxy to prevent Heka to send metrics to InfluxDB. The outage time should be equal to 3 hours
Enable InfluxDB services in haproxy backends and measure how many resources and time InfluxDB needs to get all statistic from Heka after outage.
Disbale Elasticsearch services in haproxy to prevent Heka to send metrics to Elasticsearch. The outage time should be equal to 3 hours
Enable Elasticsearch services in haproxy backends and measure how many resources and time Elasticsearch needs to get all statistic from Heka after outage.
6.14.1.3. Usage Results
6.14.1.3.1. Collector: Hekad / collectd
The following table describe how many resources was used by Hekad and Collectd during the test in depend on OpenStack role:
role |
CPU (hekad/collectd) |
Memory (hekad/collectd) |
I/O per second (hekad/collectd) |
|---|---|---|---|
controller |
0.7 cpu 0.13 cpu |
223 MB 45 MB |
730 KB write 730 KB read 0 KB write 250 KB read |
0.4 cpu 0.06 cpu |
no impact |
220 KB write 280 KB read 0 KB write 250 KB read |
|
aggregator |
0.9 cpu 0.13 cpu |
285 MB 50 MB |
830 KB write 830 KB read 0 KB write 247 KB read |
compute |
0.2 cpu 0.02 cpu |
145 MB 6.1 MB |
15 KB write 40 KB read 0 KB write 22 KB read |
compute/osd |
0.25 cpu 0.02 cpu |
154 MB 13 MB |
15 KB write 40 KB read 0 KB write 23 KB read |
6.14.1.3.2. Influxdb
InfluxDB consumes manageable amount of CPU (more information in the table below). The compaction operation is performed regularly which produces spike of resource consumption (every ~ 6 minutes with the actual load of 200 nodes / 1000 VMs):
The average write operation duration is 3ms (SSD drive)
Conditions |
write/s |
(normal /spike) |
(normal /spike) |
(normal/ spike) |
|---|---|---|---|---|
normal |
111 HTTP writes/s (37 w/s per node) |
0.38 cpu 2 cpu |
1.2GB 2.3GB |
1.3MB(r)/1.7MB(w) 1.5MB(r)/7.3MB(w) |
75 HTTP writes/s (25 w/s per node) (-30% w/o rabbitmq queues) |
0.3 cpu 1.9 cpu |
1.2GB 2.2GB |
930KB(r)/1MB(w) 1.5MB(r)/7.3MB(w) |
|
w/o rabbitMQ and 1000 VMs |
(31 w/s per node)
|
0.5 cpu 2.5 cpu |
1.5 GB 2 GB |
1MB(r)/1.4MB(w) 1.2MB(r)/6.6MB(w) |
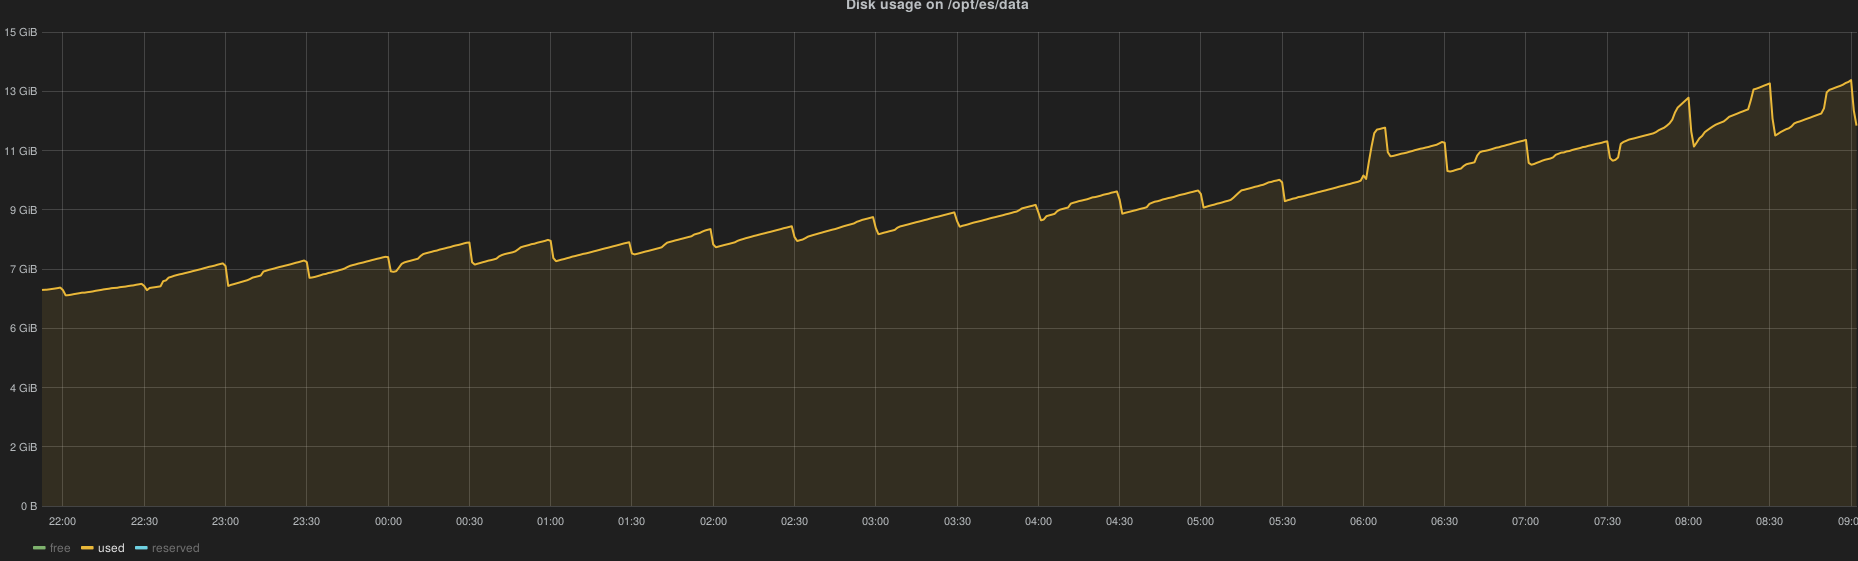
Disk space usage evolution with 1000 VMs:
~125 MB / hour
~3 GB / day
~90 GB / month
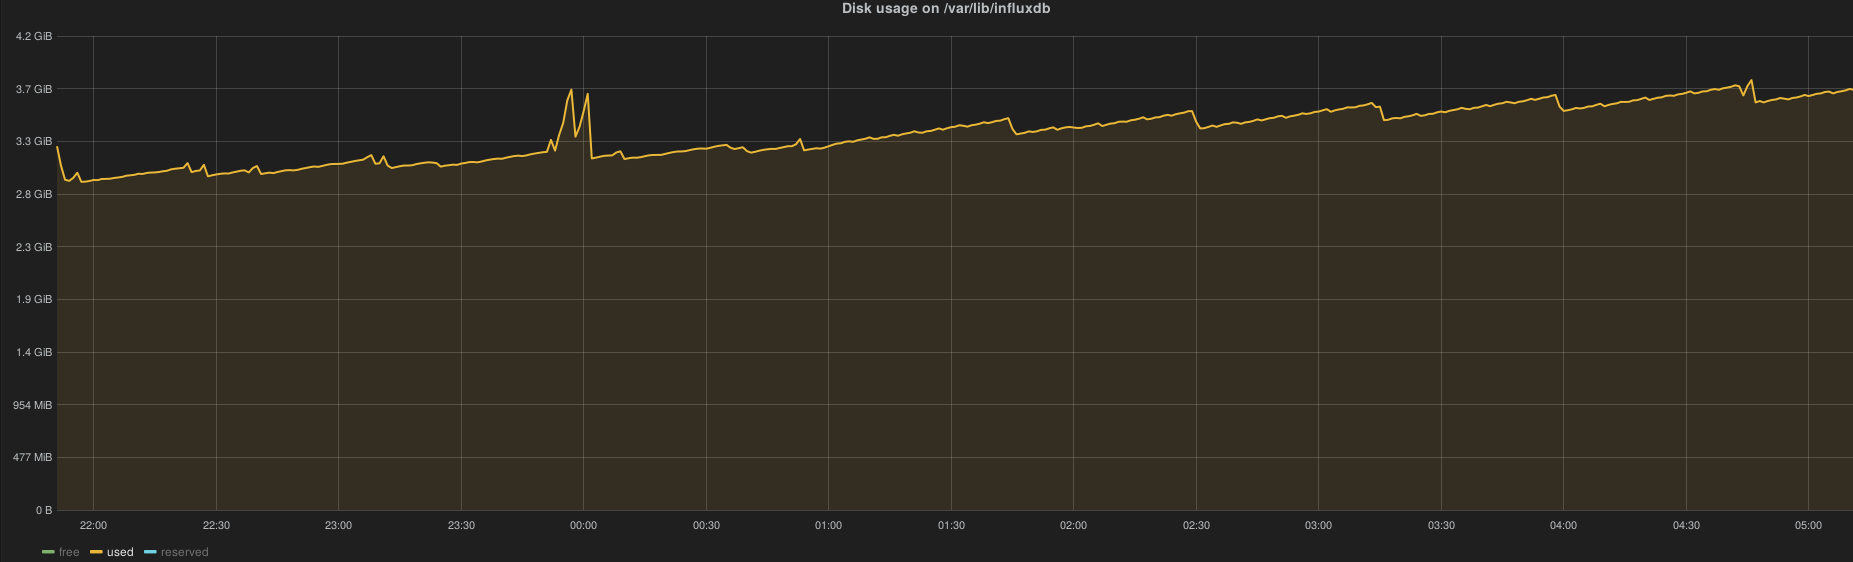
6.14.1.3.3. Elasticsearch
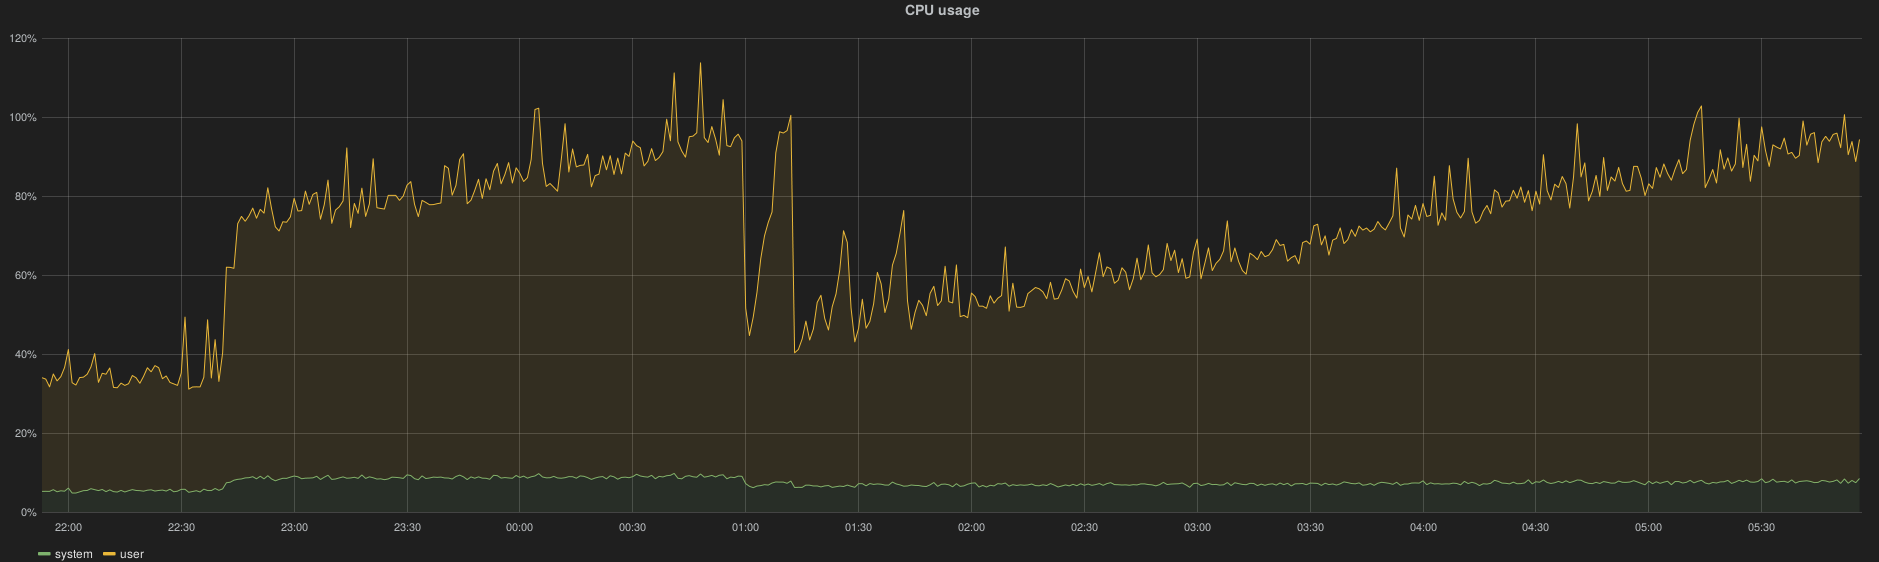
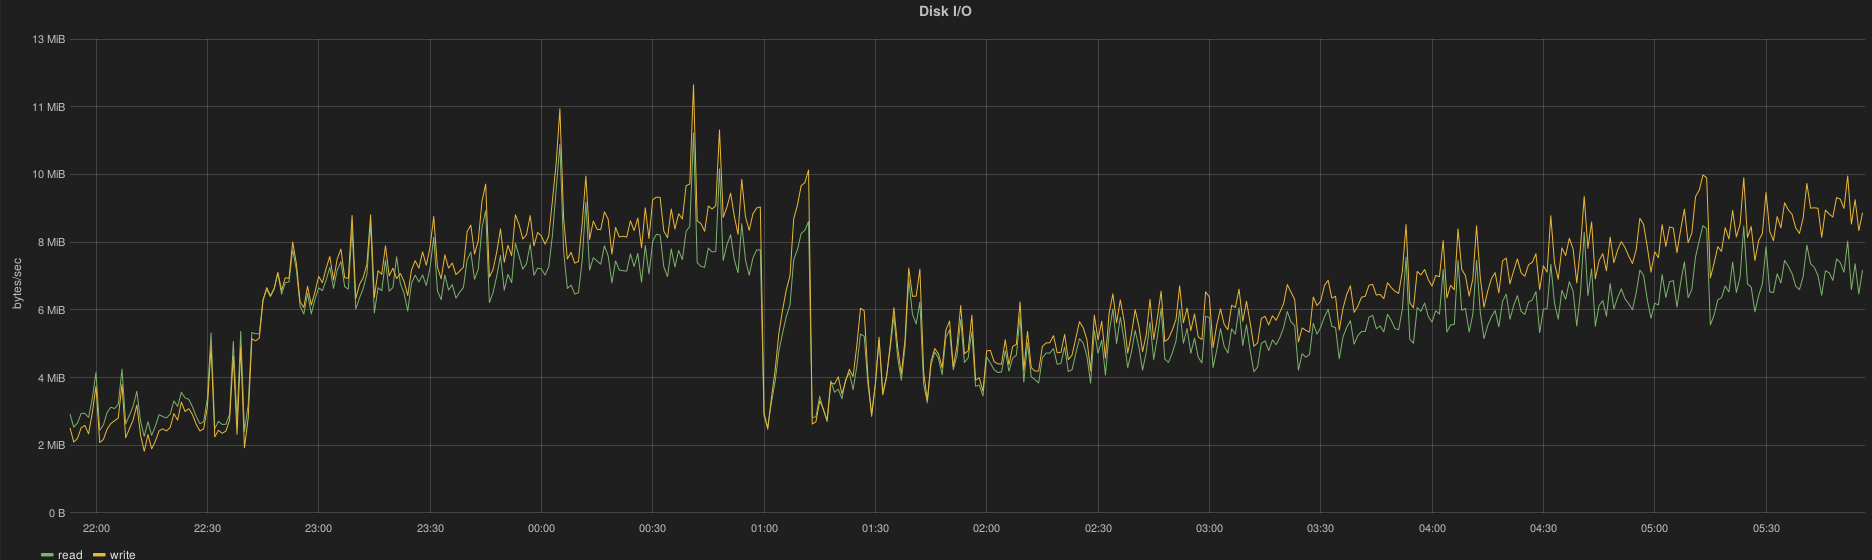
The bulk operations takes ~80 ms (mean) on SATA disk (this is the mean response time from HAProxy log).
The CPU usage depends on the REST API activity (see the extra load in the graph below) and also seems to depends on the current index size (CPU utilization increases proportionally while the load is constant):
Disk space usage evolution with a constant API solicitation (eg, while true; nova|cinder|neutron list); done) and 1000 VMs spawned:
~670 MB / hour
~16 GB / day
~500 GB / month
6.14.1.3.4. All RabbitMQ queues collection impact
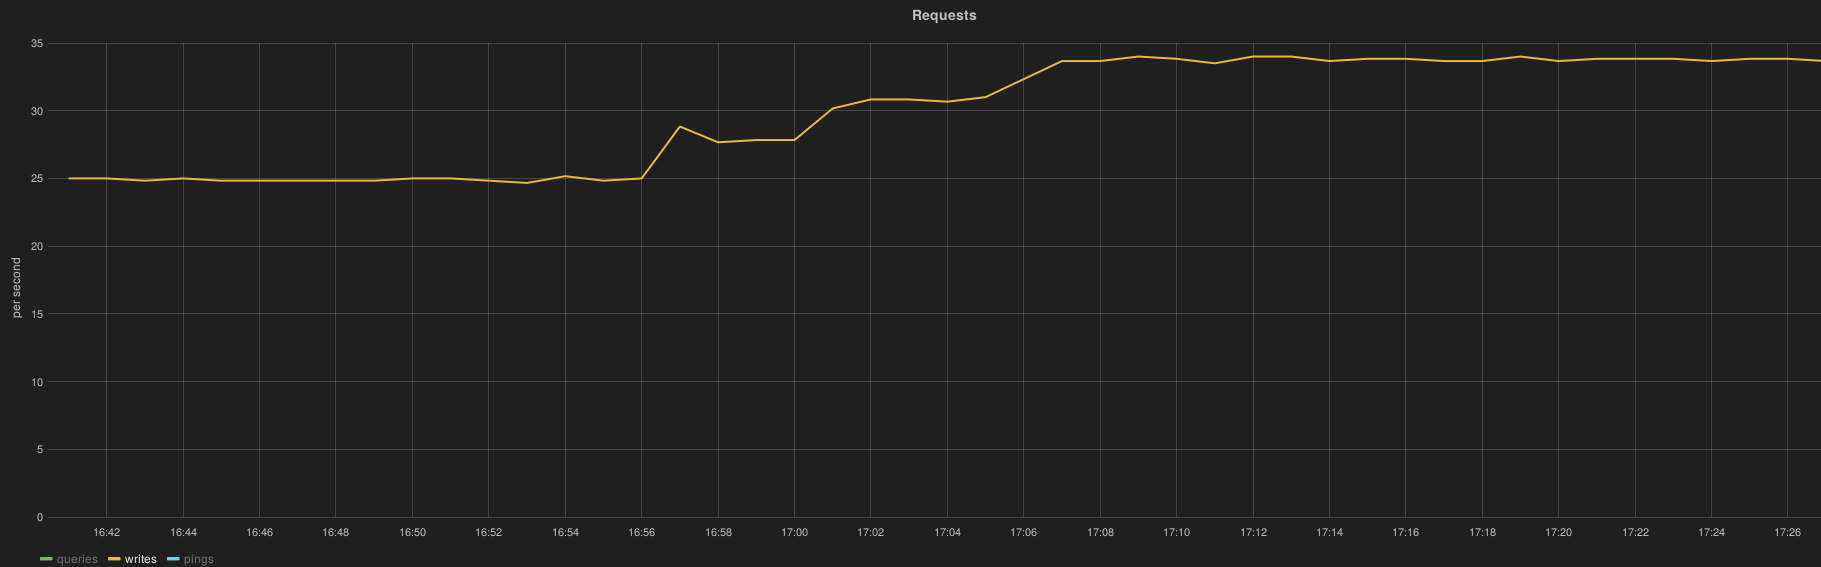
The collection of all RabbitMQ queue metrics has a significant impact on Heka and Collectd CPU utilization and obviously on the InfluxDB load (HTTP request per second)
Heka
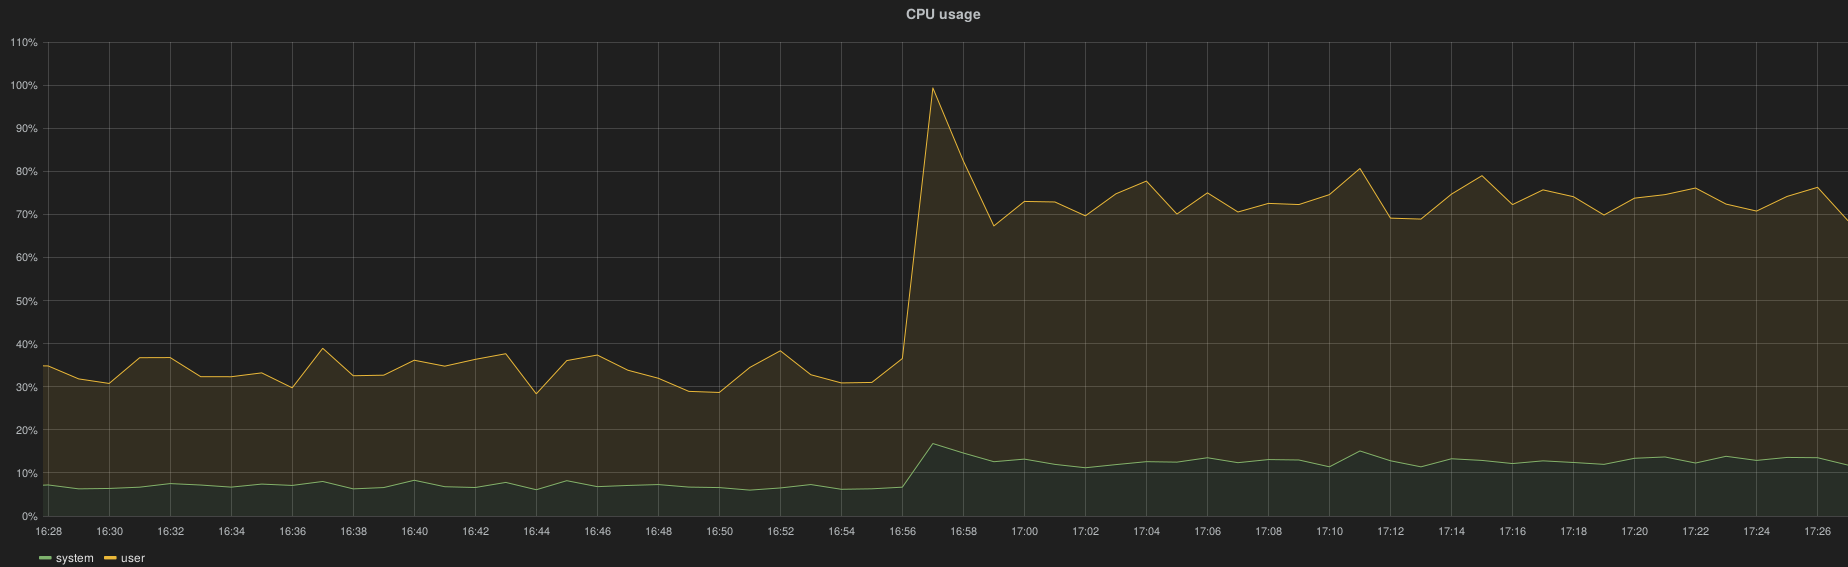
Collectd
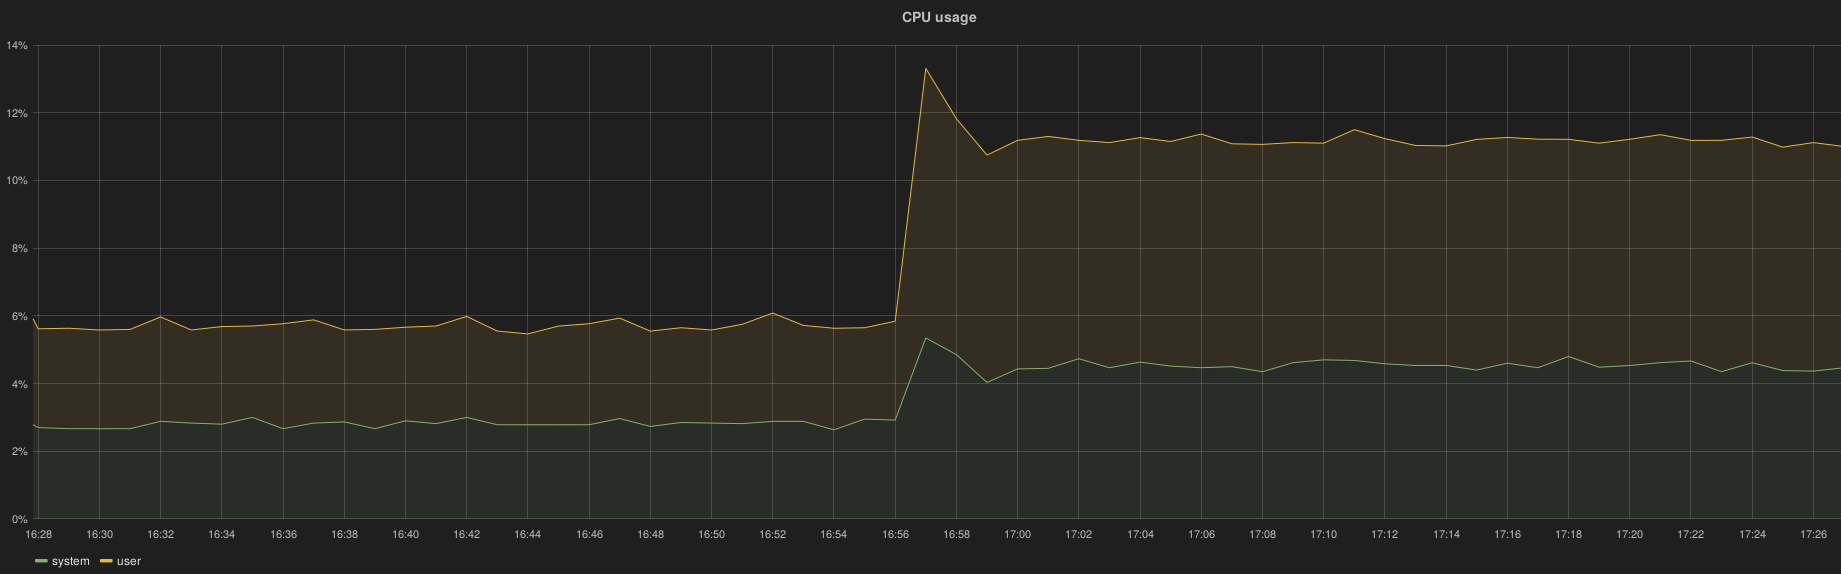
InfluxDB
6.14.1.4. Reliability Results
6.14.1.4.1. Backends outage for 2 hours
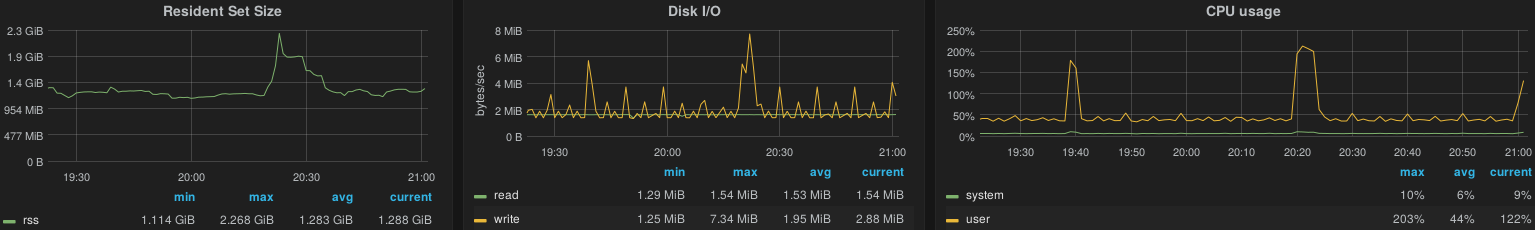
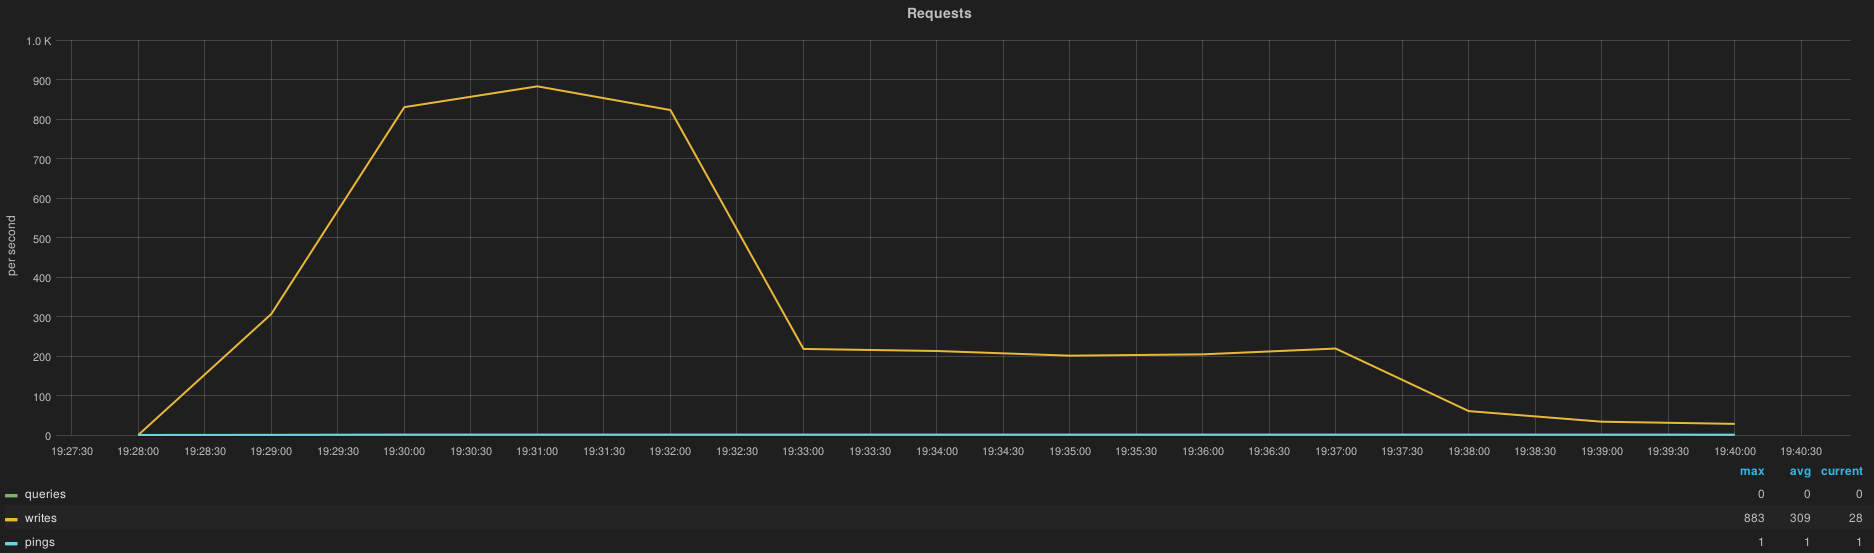
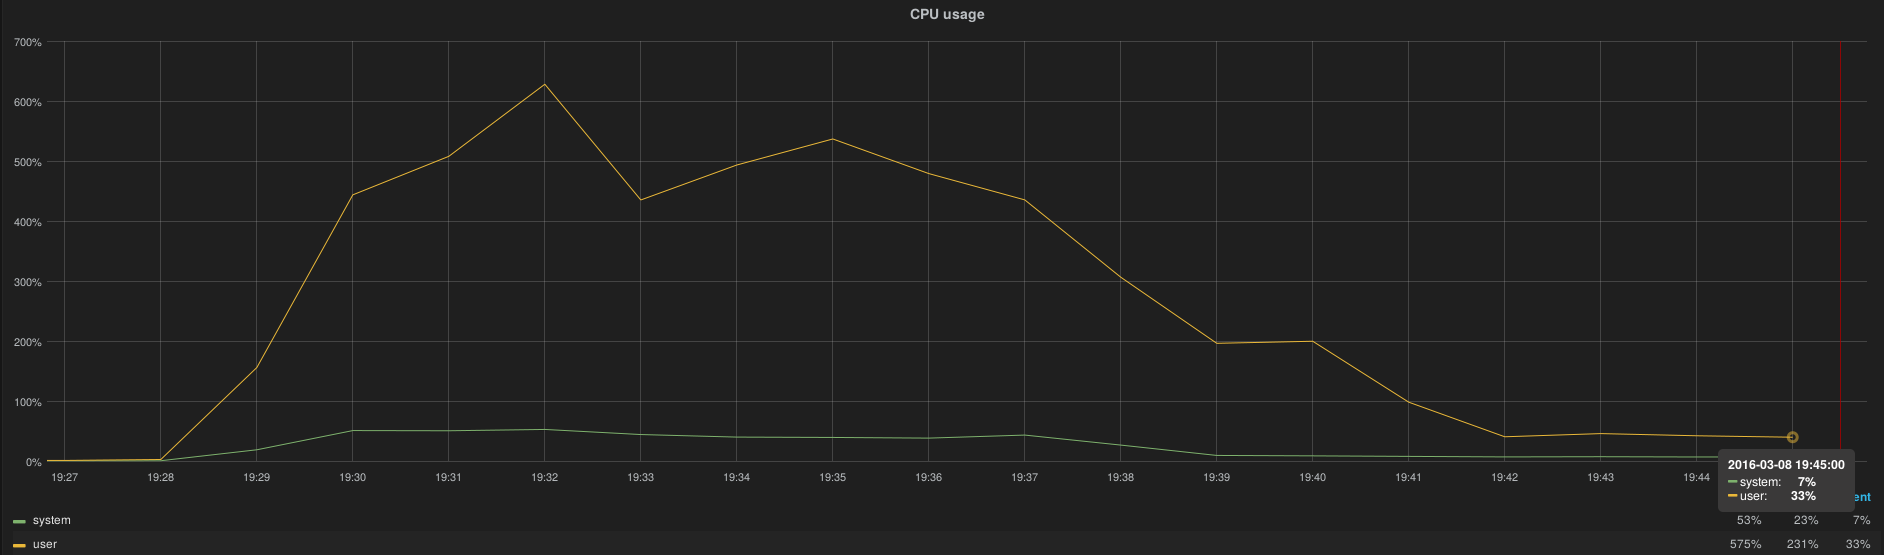
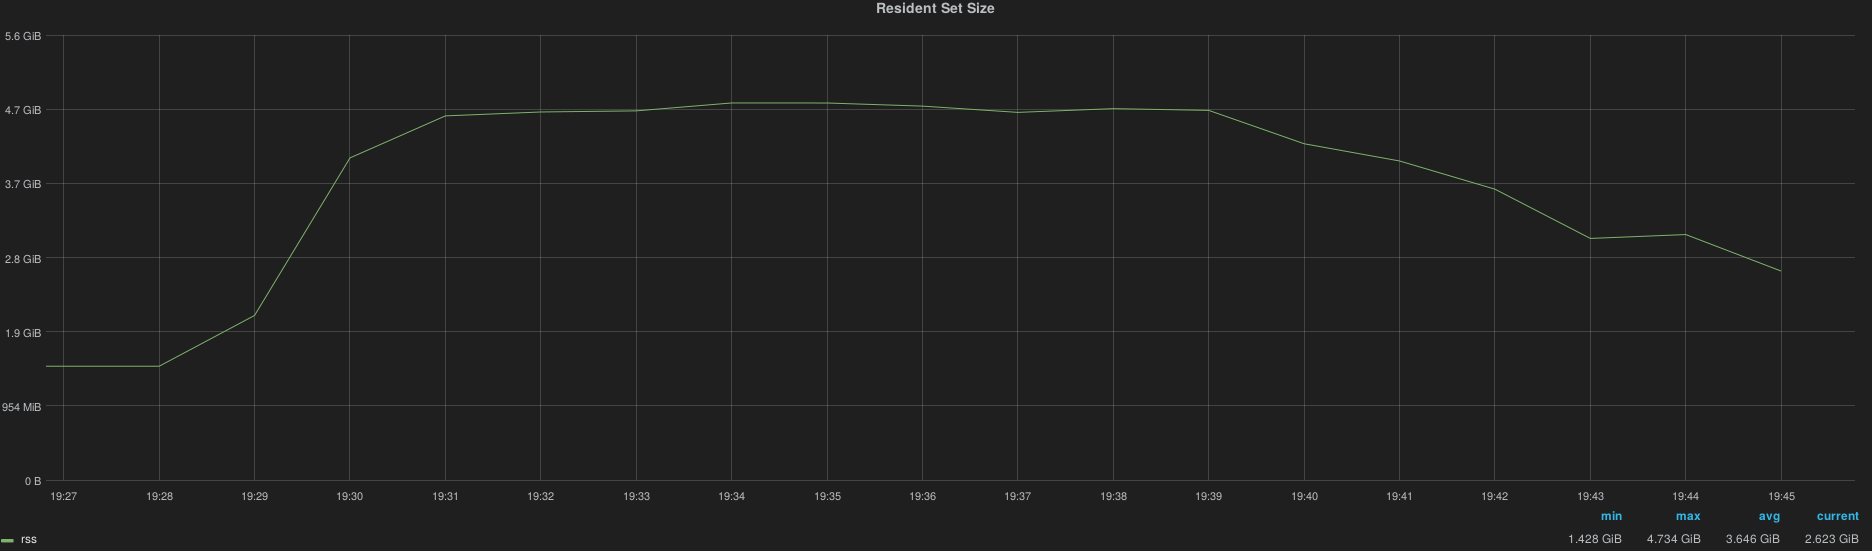
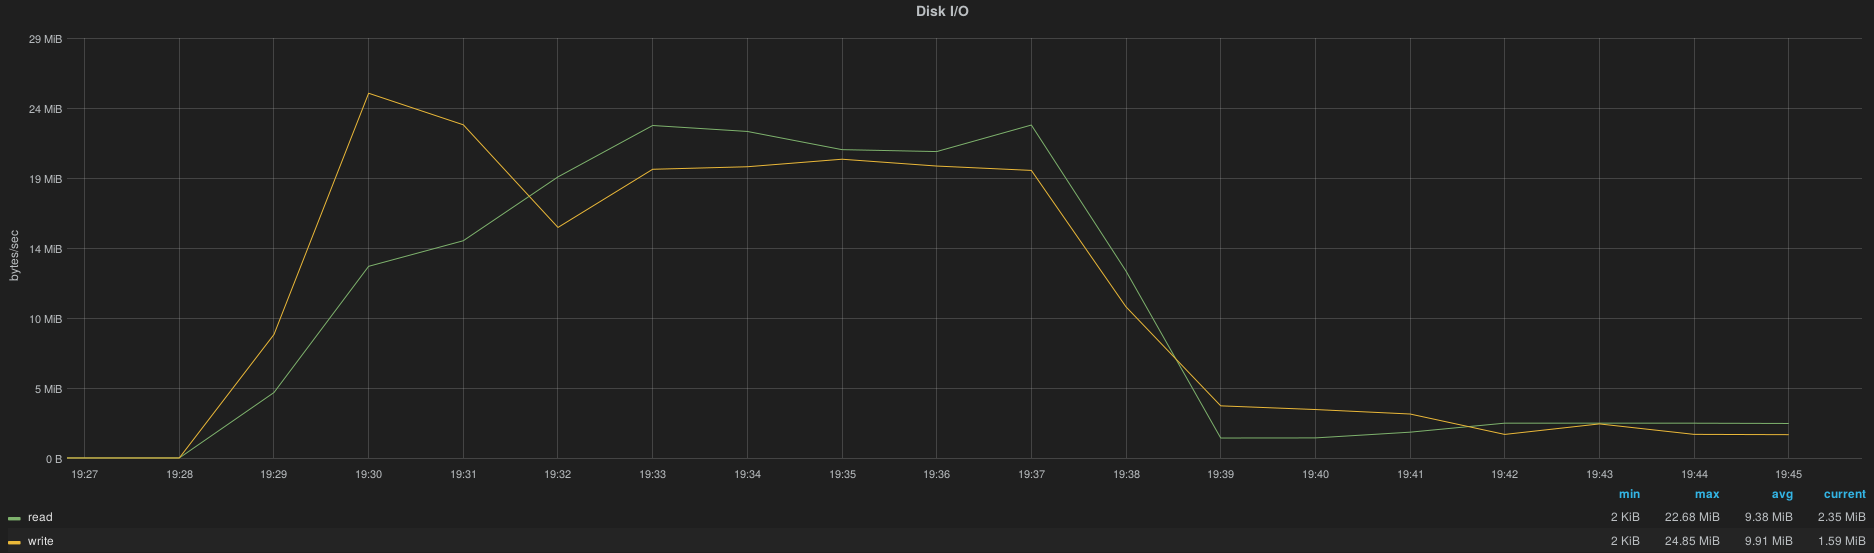
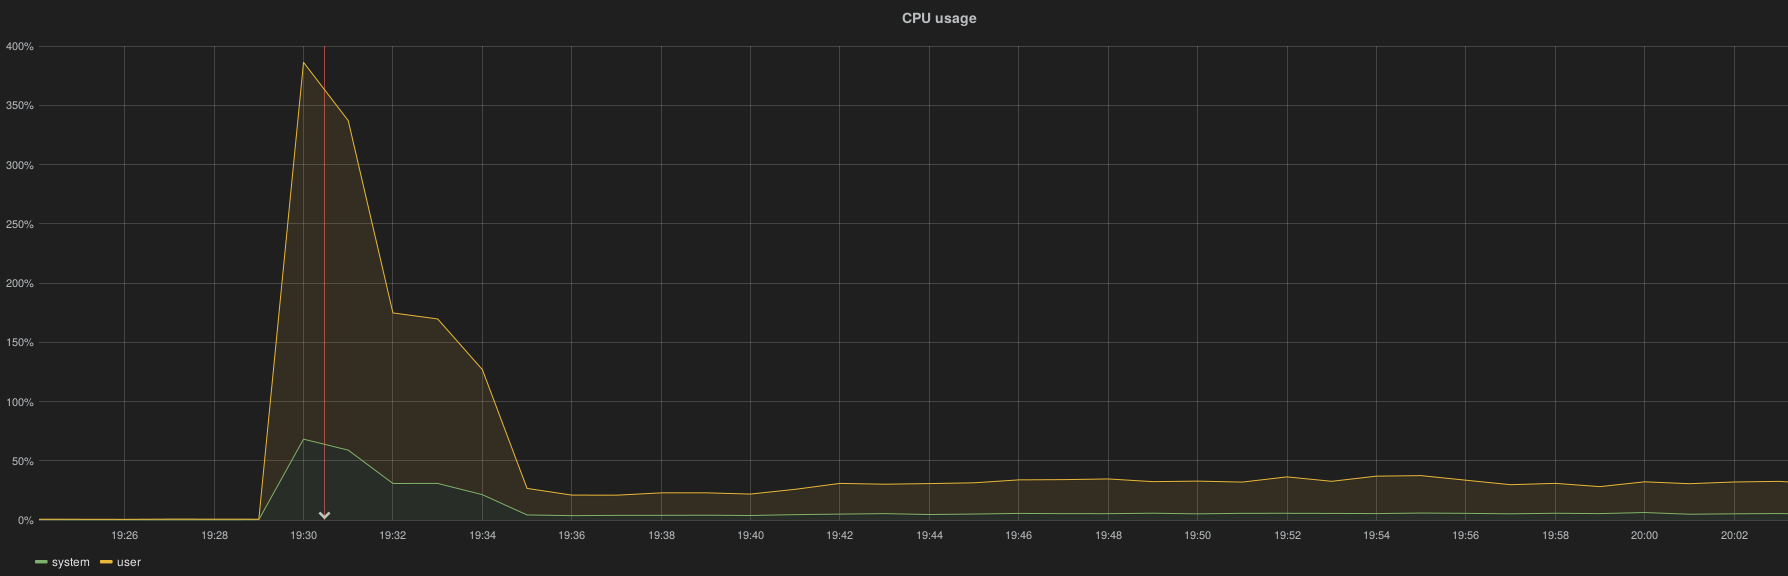
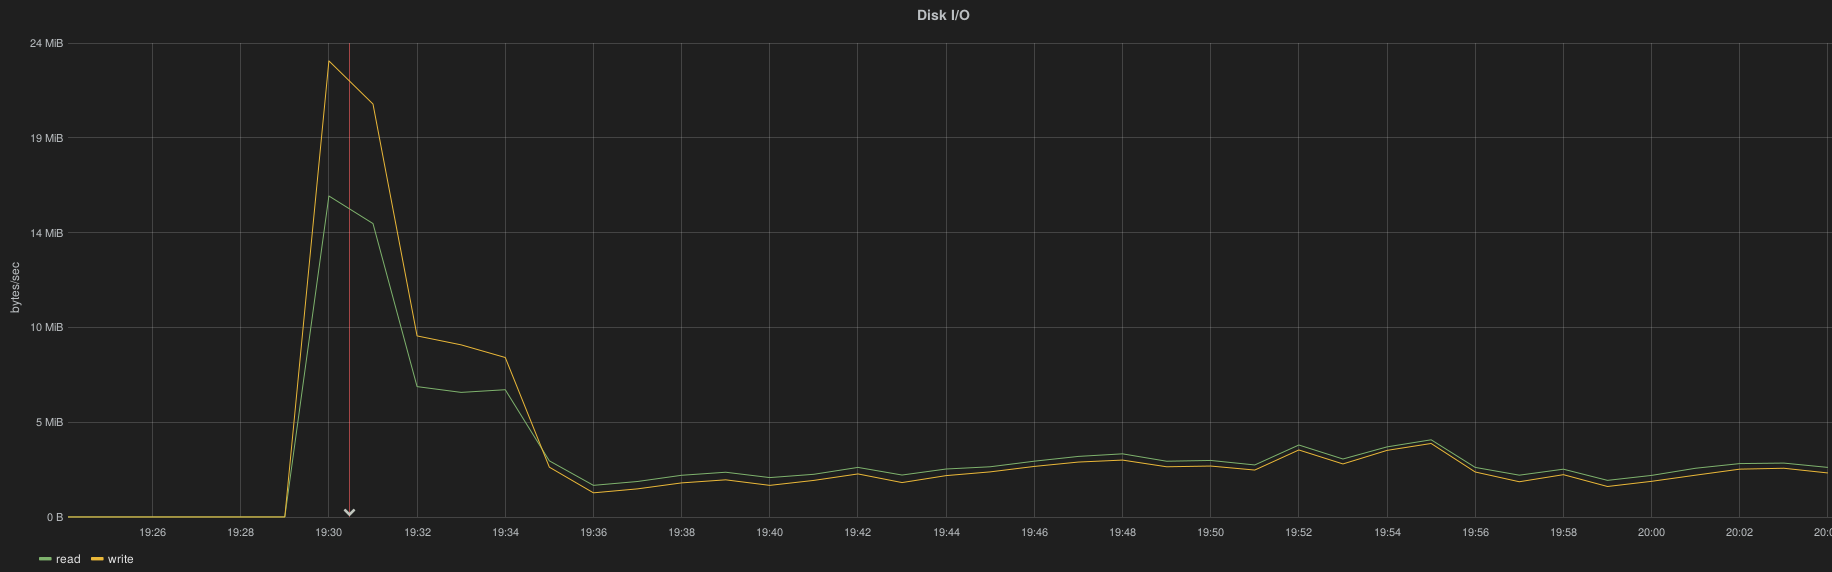
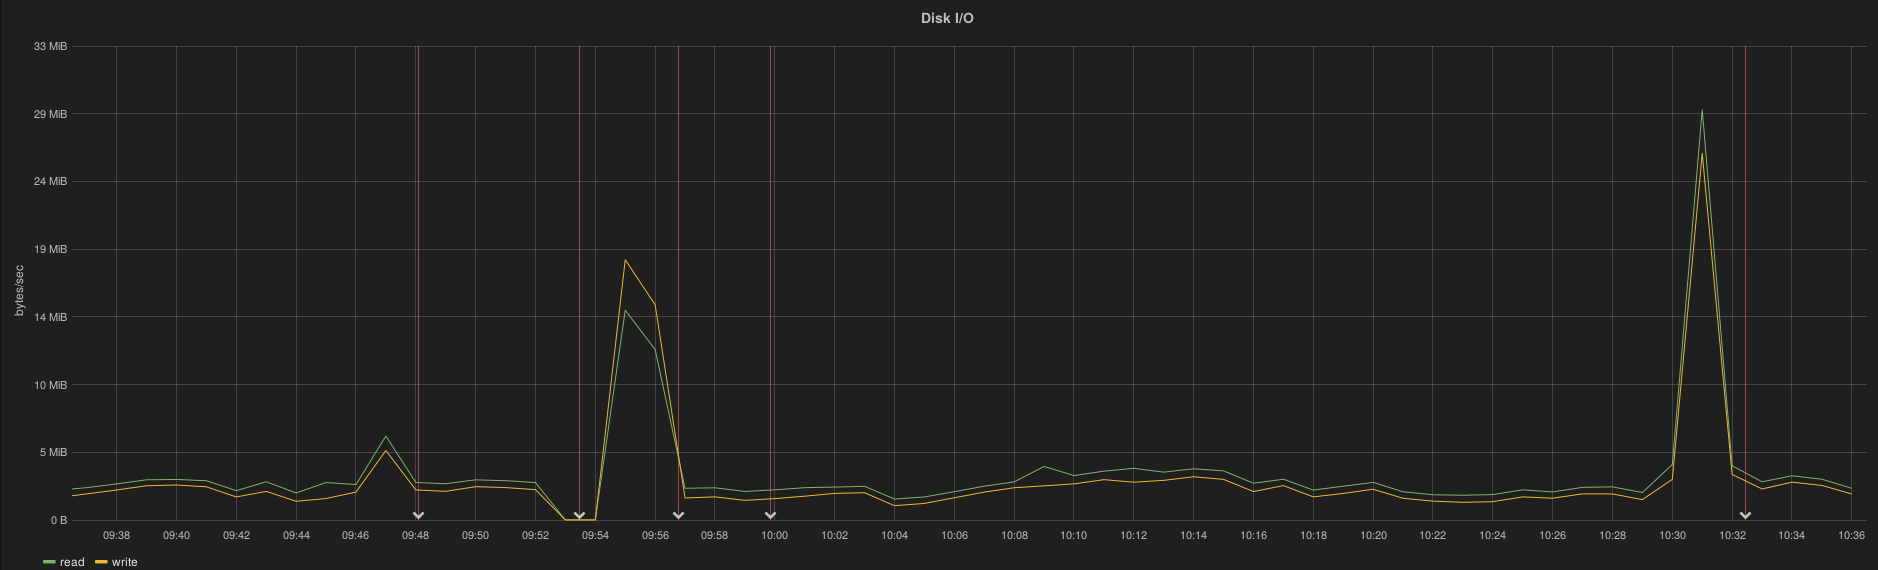
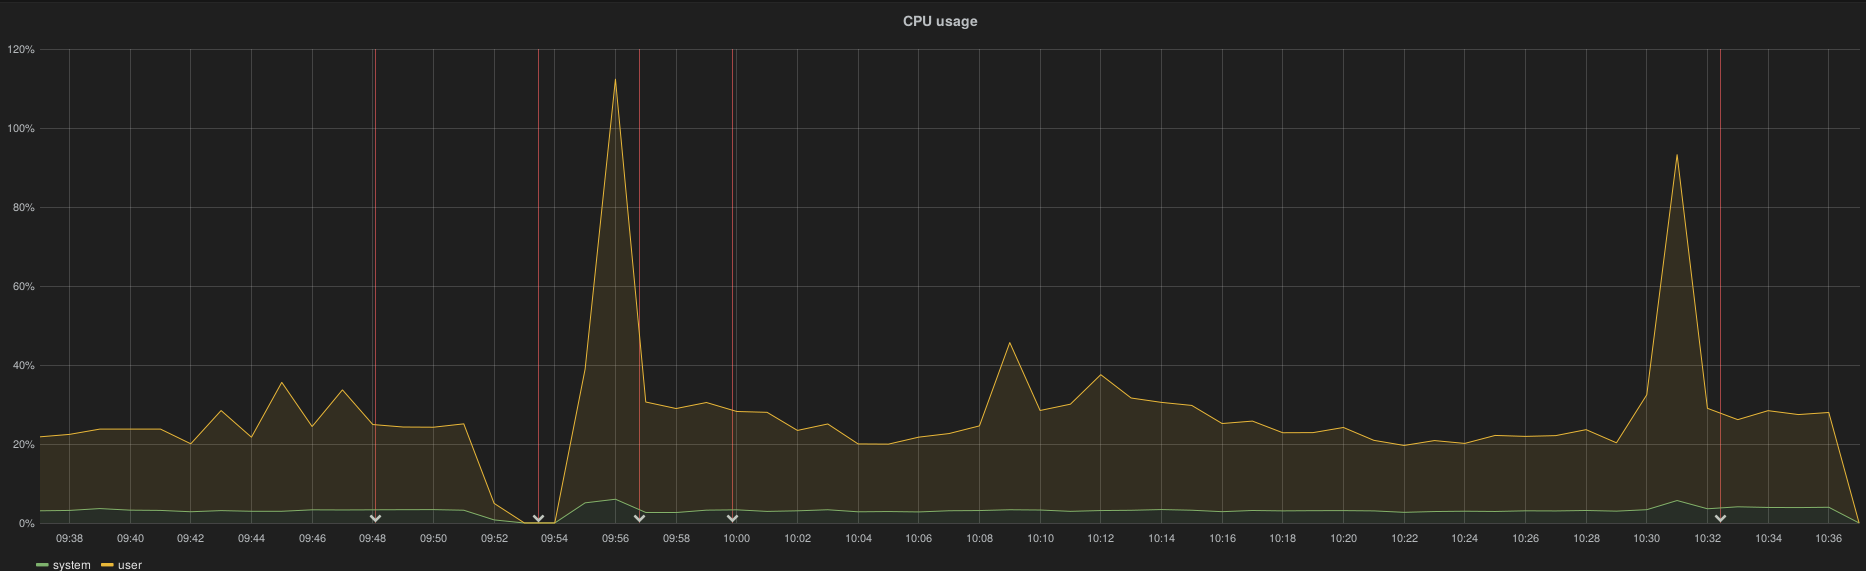
After a complete InfluxDB cluster downtime (simulated by a HAProxy shutdown) the cluster is capable to take over all metrics accumulated by Heka instances in less than 10 minutes, here is the spike of resource consumption per node.
Conditions |
write/s |
cpu |
memory |
I/O |
|---|---|---|---|---|
take over 3 hours
of metrics
|
~900 w/s
total of 2700 HTTP writes/s
|
6.1cpu
|
4.8GB
|
22MB(r)
25MB(w)
|
 fuel nodes
6.14.1.4.1.1. Data loss
A window of less than 40 minutes of metrics are lost on controllers.
Other node roles have no data loss because they have much less metrics collected than controllers. Hence, the heka buffer size (1GB) for influxdb queue is filled within ~1h20.
This retention period can be increased drastically by avoiding to collect all the rabbitmq queues metrics.
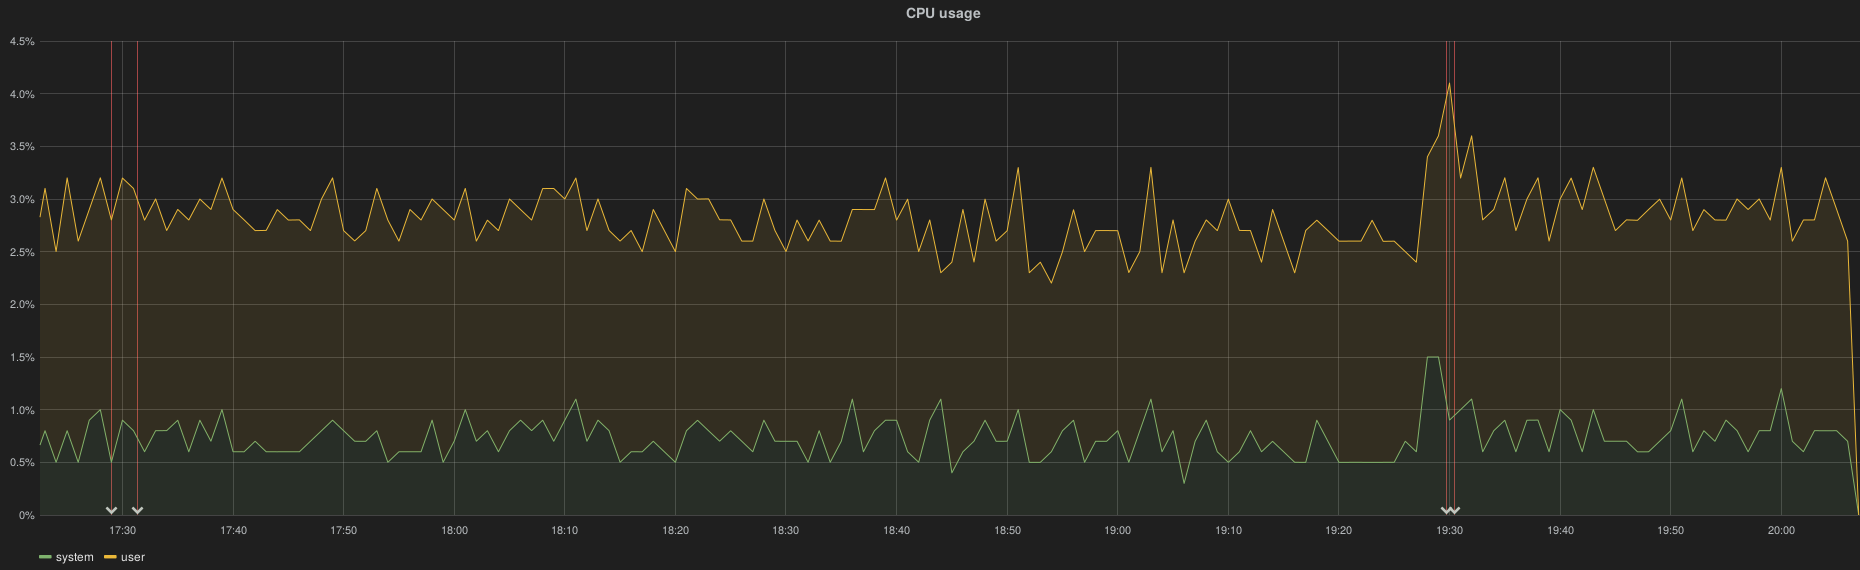
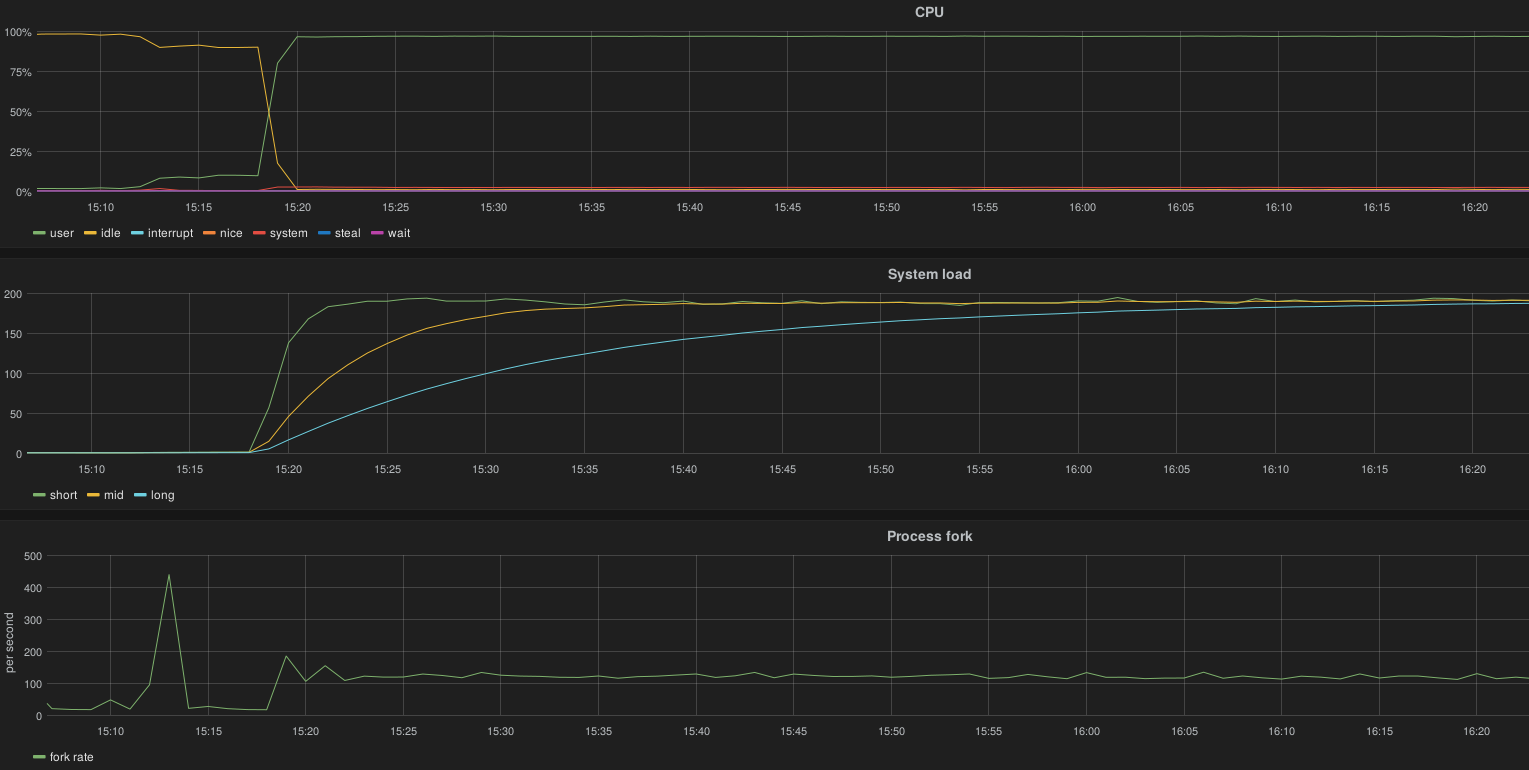
The following examples show both controller and compute/osd CPU metric. The 2 first annotations indicate the downtime (InfluxDB and Elasticsearch) while the 2 last annotations indicate the recovery status.
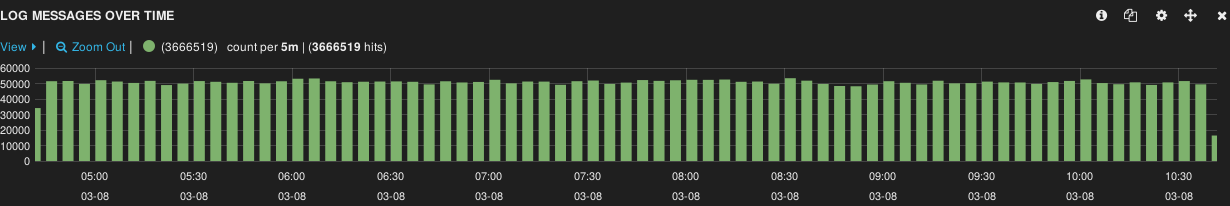
On controller node the CPU metric is lost from 18h52 to 19h29 while the InfluxDB outage ran from ~17h30 to 19h30:
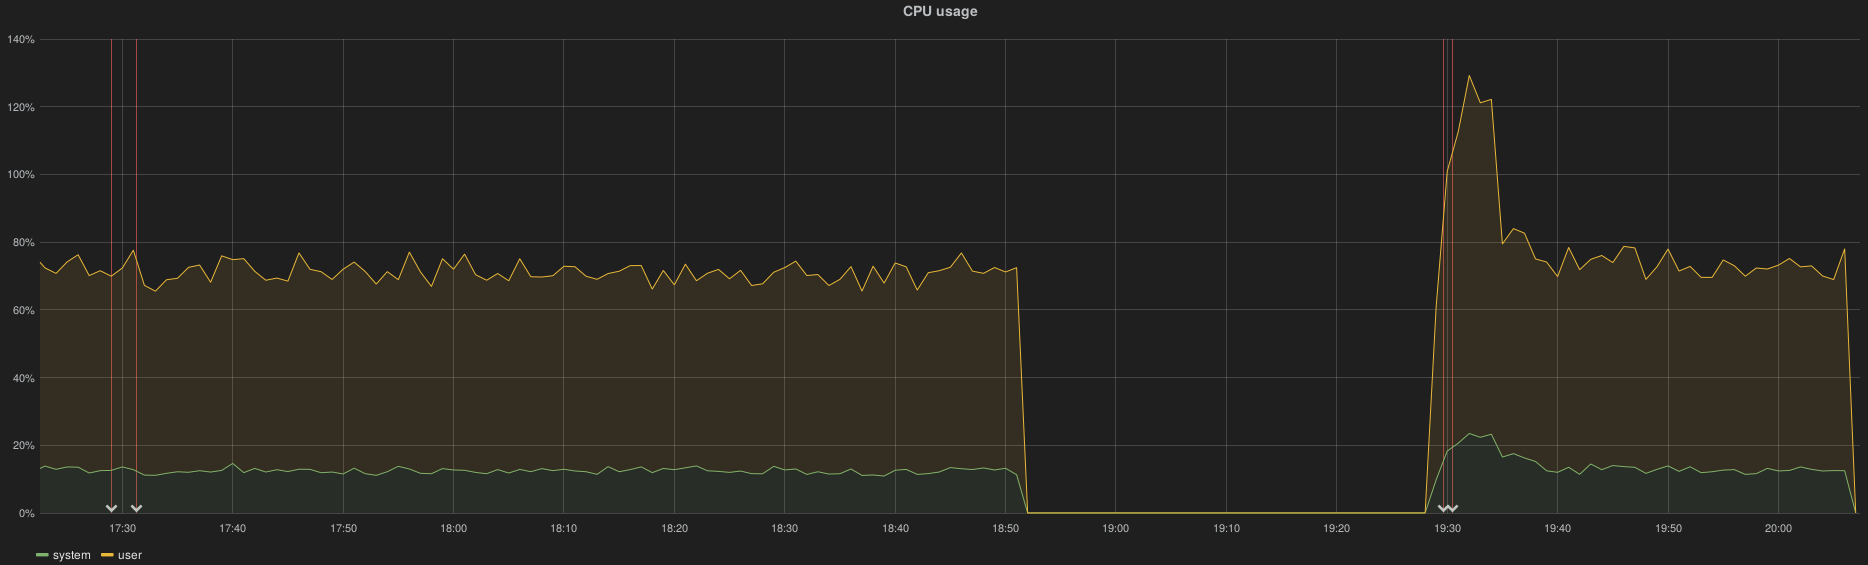
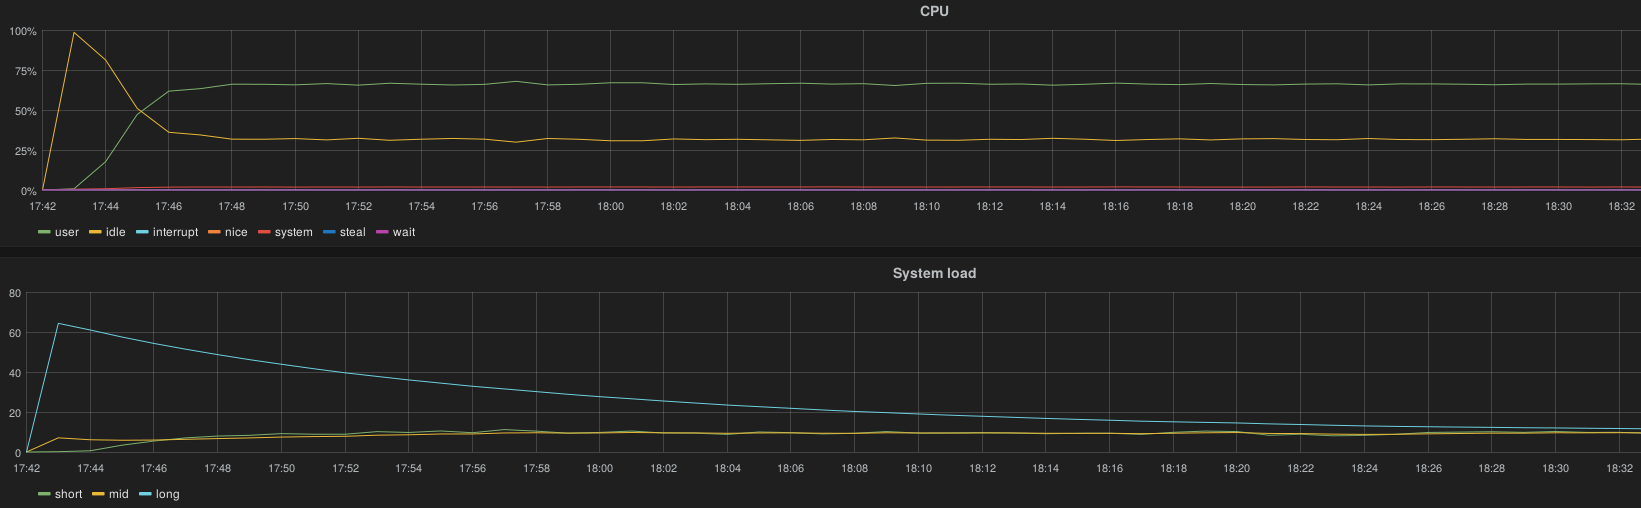
A role with osd/compute roles didn’t lose metrics:
6.14.1.4.1.1.1. Elasticsearch
After a complete ES cluster downtime (simulated by an HAProxy shutdown) the cluster is capable to take over all logs accumulated by Hekad instances in less than 10 minutes, here the spike resource consumption per node
Conditions |
HTTP bulk request/s |
cpu |
memory (normal/spike) |
I/O normal/spike |
|---|---|---|---|---|
take over 3 hours
of logs
|
680 req/s
|
4 cpu
|
16GB (jvm fixed size)
|
26 MB (r)
25 MB (w)
|
CPU utilization:
I/O
6.14.1.4.1.2. Data lost
We lost some logs (and maybe notification) since heka log has a bunch of “queue is full”
6.14.1.4.1.2.1. Apache2/Nagios3
Apache is flooded and never recover the load
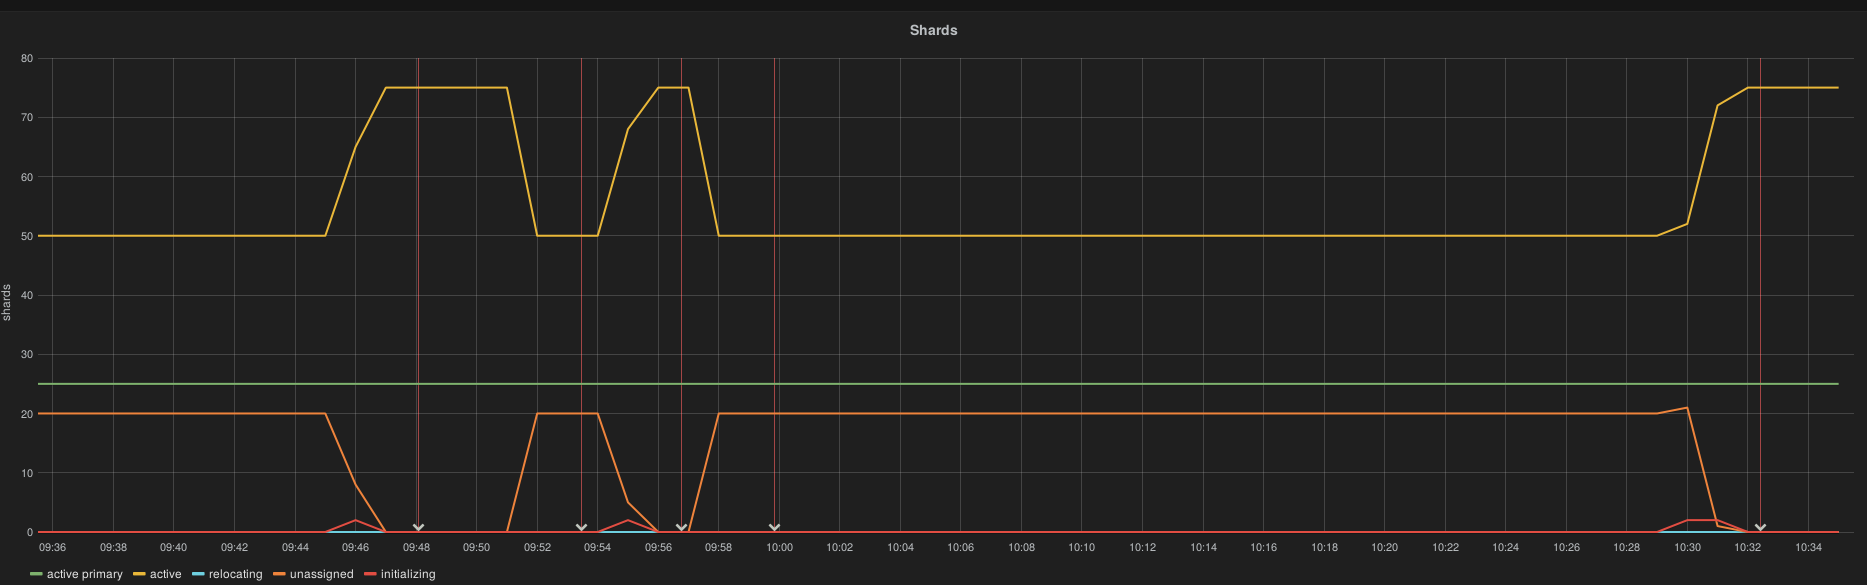
6.14.1.4.2. Elasticsearch failover/recovery
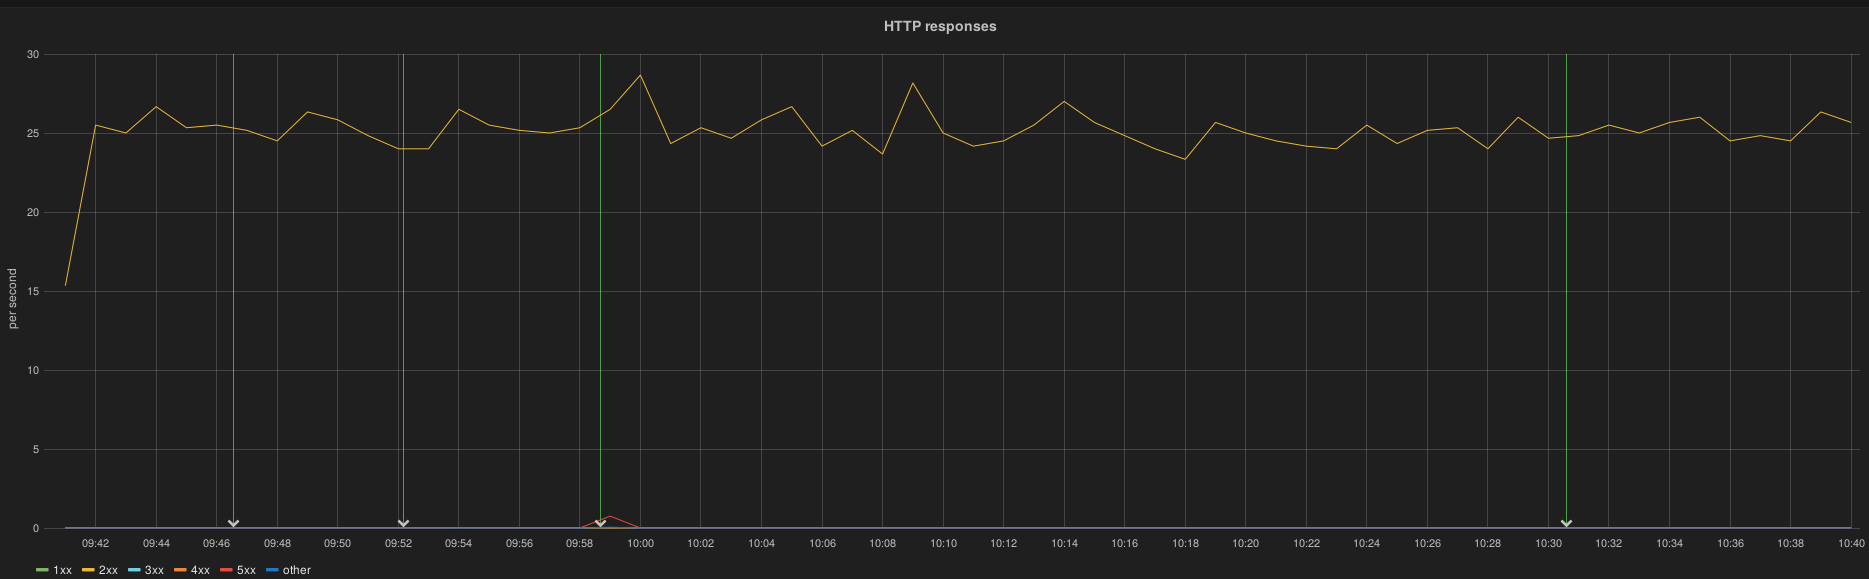
The cluster is detected as WARNING (cannot honor the number of replicas) but there is no downtime observed and no data lost since the cluster accepts data.
root@node-47:~# curl 192.168.0.4:9200/\_cluster/health?pretty

{

"cluster\_name" : "lma",

**"status" : "yellow",**

"timed\_out" : false,

"number\_of\_nodes" : 2,

"number\_of\_data\_nodes" : 2,

"active\_primary\_shards" : 25,

"active\_shards" : 50,

"relocating\_shards" : 0,

"initializing\_shards" : 0,

"unassigned\_shards" : 20,

"delayed\_unassigned\_shards" : 0,

"number\_of\_pending\_tasks" : 0,

"number\_of\_in\_flight\_fetch" : 0

}

root@node-47:~# curl 192.168.0.4:9200/\_cat/indices?v

health status index pri rep docs.count docs.deleted store.size
pri.store.size

green open kibana-int 5 1 2 0 52.1kb 26.1kb

yellow open log-2016.03.08 5 2 5457994 0 2.1gb 1gb

yellow open log-2016.03.07 5 2 10176926 0 3.7gb 1.8gb

yellow open notification-2016.03.08 5 2 1786 0 3.5mb 1.9mb

yellow open notification-2016.03.07 5 2 2103 0 3.7mb 1.8mb
The cluster is unavailable, all heka buffersize data until recovery.
root@node-47:~# curl 192.168.0.4:9200/_cluster/health?pretty
{
“error” : “MasterNotDiscoveredException[waited for [30s]]”,
“status” : 503
}
ES logs
[2016-03-08 09:48:10,758][INFO ][cluster.service ] [node-47.domain.tld_es-01] removed {[node-153.domain.tld_es-01][bIVAau9SRc-K3lomVAe1_A][node-153.domain.tld][inet[/192.168.0.163:9
300]]{master=true},}, reason: zen-disco-receive(from master [[node-204.domain.tld_es-01][SLMBNAvcRt6DWQdNvFE4Yw][node-204.domain.tld][inet[/192.168.0.138:9300]]{master=true}])
[2016-03-08 09:48:12,375][INFO ][discovery.zen ] [node-47.domain.tld_es-01] master_left [[node-204.domain.tld_es-01][SLMBNAvcRt6DWQdNvFE4Yw][node-204.domain.tld][inet[/192.168.0.1
38:9300]]{master=true}], reason [transport disconnected]
[2016-03-08 09:48:12,375][WARN ][discovery.zen ] [node-47.domain.tld_es-01] master left (reason = transport disconnected), current nodes: {[node-47.domain.tld_es-01][l-UXgVBgSze7g
twc6Lt_yw][node-47.domain.tld][inet[/192.168.0.108:9300]]{master=true},}
[2016-03-08 09:48:12,375][INFO ][cluster.service ] [node-47.domain.tld_es-01] removed {[node-204.domain.tld_es-01][SLMBNAvcRt6DWQdNvFE4Yw][node-204.domain.tld][inet[/192.168.0.138:9
300]]{master=true},}, reason: zen-disco-master_failed ([node-204.domain.tld_es-01][SLMBNAvcRt6DWQdNvFE4Yw][node-204.domain.tld][inet[/192.168.0.138:9300]]{master=true})
[2016-03-08 09:48:21,385][DEBUG][action.admin.cluster.health] [node-47.domain.tld_es-01] no known master node, scheduling a retry
[2016-03-08 09:48:32,482][DEBUG][action.admin.indices.get ] [node-47.domain.tld_es-01] no known master node, scheduling a retry
LMA collector logs:
2016/03/08 09:54:00 Plugin ‘elasticsearch_output’ error: HTTP response error. Status: 503 Service Unavailable. Body: {“error”:”ClusterBlockException[blocked by: [SERVICE_UNAVAILABLE/2/no master];]”,”status”:503}
6.14.1.4.3. InfluxDB failover/recovery
no downtime
One node is in a bad shape (missing data during and after the outage!)
This is not supported
6.14.1.4.4. Apache2 overloaded
Note
The issue described in this section has been resolved in 0.10 version. You can read more here https://blueprints.launchpad.net/lma-toolchain/+spec/scalable-nagios-api
All nodes push AFD status to Nagios through the CGI script. This represent 110 request/s
The server cannot handle the load:
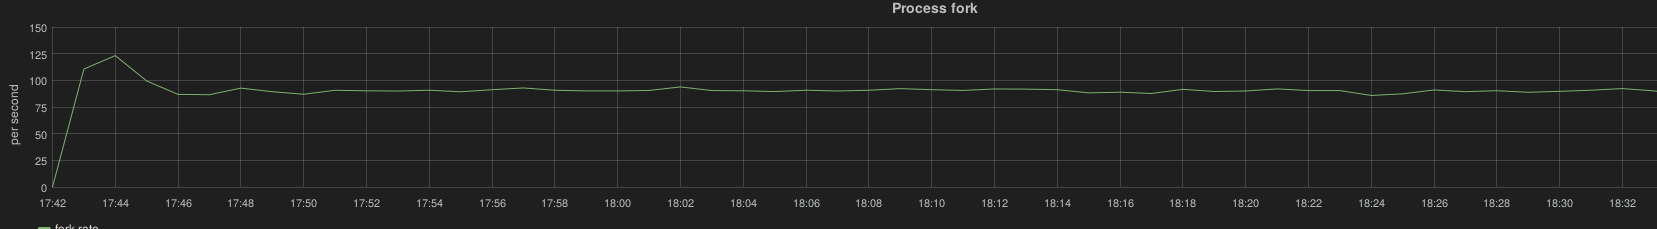
100% CPU (12), load average 190, 125 process fork/s
The CGI script is definitively not scalable.
When increasing the AFD interval from 10 to 20 seconds on all nodes and purging the heka output queue buffer, the load is maintainable by node (90 forks / second):
6.14.1.5. Outcomes
6.14.1.5.1. InfluxDB
InfluxDB worked correctly only with SSD drives. With SATA drives, it was unable to cope with the data generated by 200 nodes.
Supported scale-up operations: 1 node -> 3 nodes.
Failover mode: a cluster of 3 nodes supports the loss of 1 node.
Deployment size <= 200 nodes 4 cpu 4 GB RAM SSD drive 100 GB is required for retention of 30 days
6.14.1.5.2. Elasticsearch
Elasticsearch can handle the load with a dedicated SATA disk, using SSD drives is obviously a better choice but not mandatory.
Supported scale-up operations: 1 node -> 3 nodes
Failover mode: a cluster of 3 nodes survives after the loss of 1 node. It can also support the loss of 2 nodes with downtime (when using the default configuration of number_of_replicas).
Note
When OpenStack services are configured with DEBUG log level and relatively high load on the cluster (several API calls for some time) could lead to fill up the Heka buffers.
6.14.1.5.3. Sizing guide
These guidelines apply for an environment configured to log at the INFO level. They take info account a high rate of API calls. Using the DEBUG log level implies much more resource consumption in terms of disk space (~ x5) and CPU/Memory (~ x2).
Deployment size <= 200 nodes 4 CPU 8 GB RAM SSD or SATA drive 500 GB is required for retention of 30 days
Apache2/Nagios3
Note
The following issue has been resolved in 0.10 version. Therefore you don’t need to apply the workaround described bellow.
The default configuration doesn’t allow to handle the load of 200 nodes: the CGI script introduces a bottleneck. The recommendation for 0.9.0 is not to deploy the lma_infrastructure_alerting plugin for an environment with more than 50 nodes. With 200 nodes, it required at least 7 cores to handle the incoming requests.
In the current state, the recommendation to be able to handle 200 nodes is to perform this operation after the initial deployment:
increase all AFD filters interval from 10s to 20s
decrease all Nagios outputs buffering size to 500KB, to limit the flooding at startup time
stop lma_collector on all nodes
remove the heka queue buffer (rm -rf /var/log/lma_collector/nagios_output)
restart lma_collector on all nodes
6.14.1.6. Issues which have been found during the tests
Issue description |
Link |
|---|---|
Kibana dashboards unavailable after an ElasticSearch scale up
from 1 to 3 nodes
|
|
Reduce the monitoring scope of Rabbitmq queues
|
|
Nova collectd plugin timeout with a lot of instances
|
|
Apache doesn’t handle the load to process passive checks with
200 nodes
|
|
InfluxDB crash while scaling up from 1 to 2 nodes
|
