2.2. Kubernetes density test report
- Abstract
This document is the report for Kubernetes density testing
2.2.1. Environment description
This report is collected on the hardware described in Intel-Mirantis Performance-Team Lab #1.
2.2.1.1. Software
Kubernetes is installed using Kargo deployment tool on Ubuntu 16.04.1.
- Node roles:
node1: minion+master+etcd
node2: minion+master+etcd
node3: minion+etcd
node4: minion
- Software versions (test case #1):
OS: Ubuntu 16.04.1 LTS (Xenial Xerus)
Kernel: 4.4.0-47
Docker: 1.12.1
Kubernetes: 1.4.3
- Software versions (test case #2):
OS: Ubuntu 16.04.1 LTS (Xenial Xerus)
Kernel: 4.4.0-36
Docker: 1.13.1
Kubernetes: 1.5.3
2.2.2. Reports
2.2.2.1. Test Case #1: Maximum pods per node
Pod startup time is measured with help of MMM(MySQL/Master/Minions) testing suite. To schedule all pods on a single node the original replication controller for minions is updated with scheduler hint. To do this add the following lines into template’s spec section:
nodeSelector:
  kubernetes.io/hostname: node4
Pod status from Kubernetes point of view is retrieved from kubectl tool.
The process is automated with
kubectl_mon.py, which produces
output in CSV format. Charts are created by
pod_stats.py script.
Every measurement starts with empty namespace. Then Kubernetes replication controller is created with specified number of pods. We collect pod’s report time and kubectl stats. The summary data is presented below.
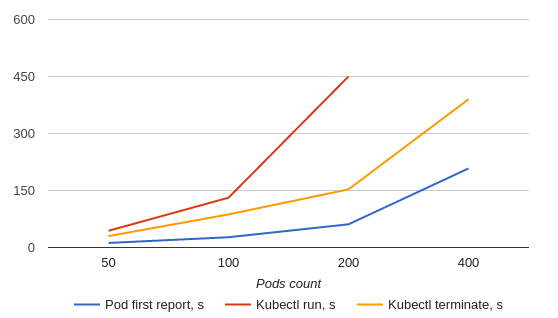
POD_COUNT |
POD_FIRST_REPORT, s |
KUBECTL_RUN, s |
KUBECTL_TERMINATE, s |
|---|---|---|---|
50 |
12 |
44 |
30 |
100 |
27 |
131 |
87 |
200 |
61 |
450 |
153 |
400 |
208 |
∞ (not finished) |
390 |
2.2.2.1.1. Detailed Stats
2.2.2.1.1.1. 50 pods
Start replication controller with 50 pods

Terminate replication controller with 50 pods

2.2.2.1.1.2. 100 pods
Start replication controller with 100 pods

Terminate replication controller with 100 pods

2.2.2.1.1.3. 200 pods
Start replication controller with 200 pods

Terminate replication controller with 200 pods

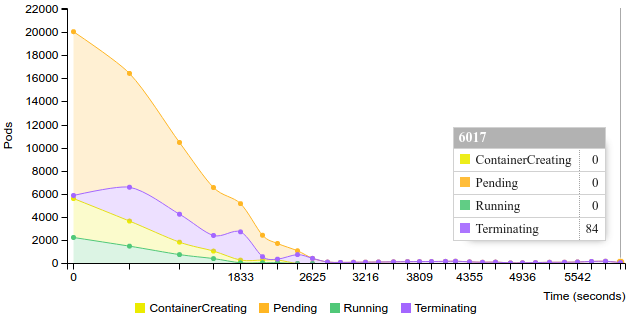
2.2.2.1.1.4. 400 pods
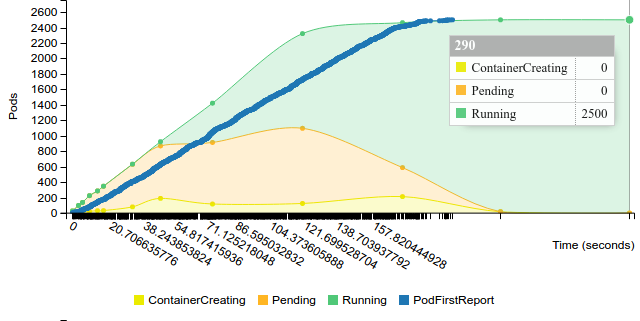
Start replication controller with 400 pods.
Note: In this experiment all pods successfully reported, however from Kubernetes API point of view less than 60 pods were in running state. The number of pods reported as running was slowly increasing over the time, but the speed was very low to treat the process as succeed.

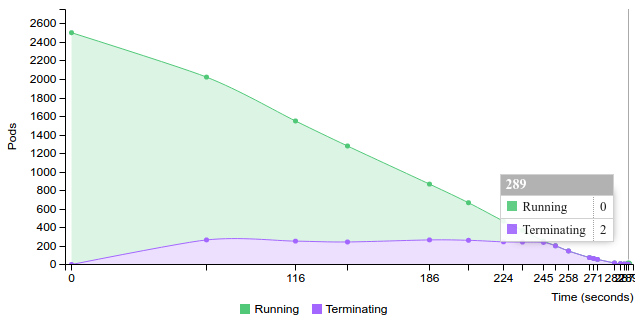
Terminate replication controller with 400 pods.

2.2.2.1.1.5. Scale by 100 pods steps
In this experiment we scale replication controller up by steps of 100 pods. Scaling process is invoked after all pods are reported as running. On step 3 (201-300 pods) the process has become significantly slower and we’ve started scaling replication controller down. The full cycle is visualized below.

System metrics from API nodes and minion are below
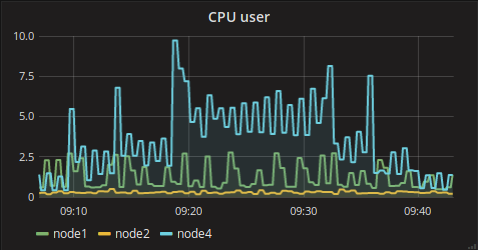
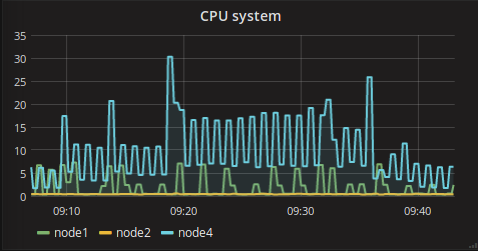
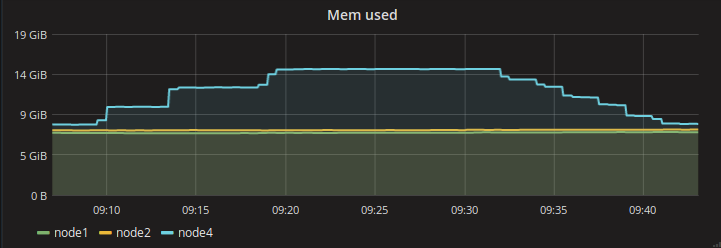
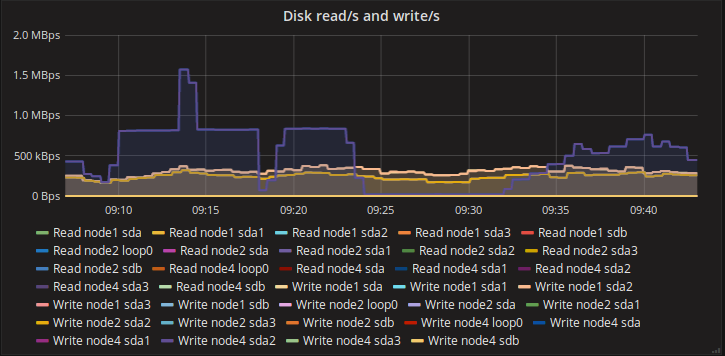
Full Kubernetes stats are available online.
2.2.2.2. Test Case #2: Measure Kubelet capacity
Pod startup time is measured with help of MMM(MySQL/Master/Minions) testing suite. Original code was updated. We added automatic creation of charts with pod’s status, when pod startup (or down). To schedule all pods on a single node the original replication controller for minions is updated with scheduler hint. To do this add the following lines into template’s spec section:
nodeSelector:
  kubernetes.io/hostname: <node>
Pod status from Kubernetes point of view is retrieved from kubectl tool.
The process is automated with
kubectl_mon_v2.py, which collects
information about pod’s status and sends to database. Charts are created by
updated MMM(MySQL/Master/Minions) testing suite.
Every measurement starts with empty namespace. Then Kubernetes replication controller is created with specified number of pods. We collect pod’s report time and kubectl stats. The summary data is presented below.
POD_COUNT |
NODE_COUNT |
POD_FIRST_REPORT, s |
KUBECTL_RUN, s |
KUBECTL_TERMINATE, s |
|---|---|---|---|---|
50 |
50 |
197 |
290 |
289 |
100 |
50 |
415 |
597 |
577 |
200 |
50 |
952 |
1218 |
1154 |
50 |
100 |
381 |
425 |
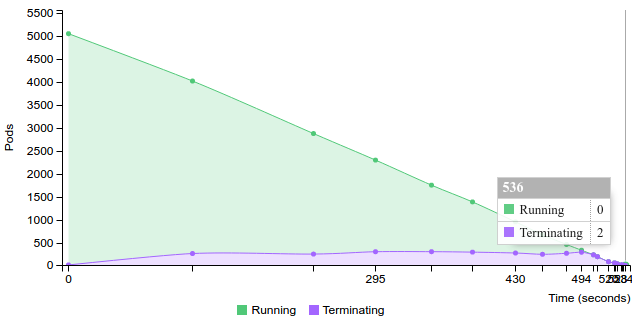
536 |
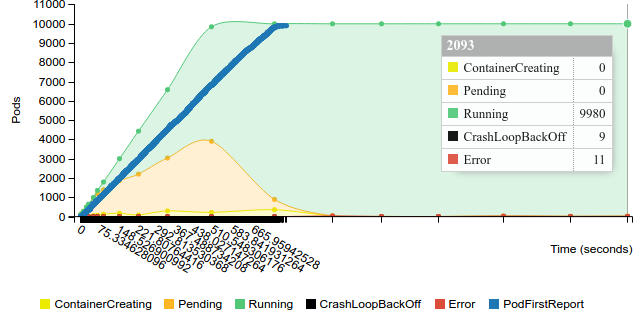
100 |
100 |
788 |
2093 (with errors) |
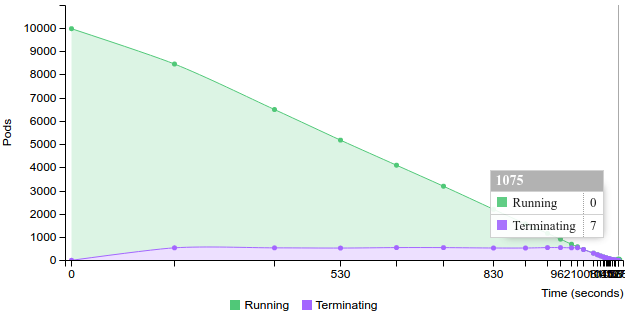
1076 |
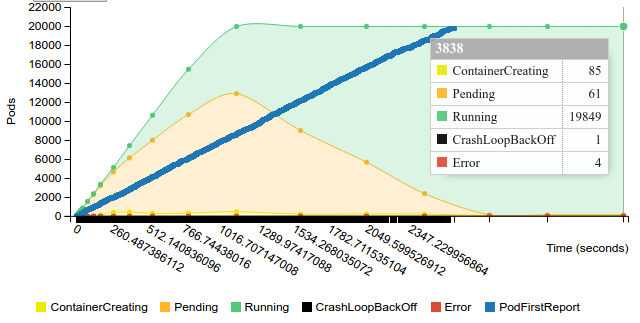
200 |
100 |
2653 |
3838 (not finished) |
3001 (not finished) |
50 |
200 |
970 |
1256 |
1032 |
100 |
200 |
1632 |
3225 |
2248 |
200 |
200 |
7098 (6.5% lost) |
8075 (not finished) |
∞ (not finished) |
50 |
400 |
1823 |
2667 (with errors) |
2038 |
100 |
400 |
7582 |
8262 (with errors) |
5200 |
400 |
50 |
9607 |
∞ (not finished) |
∞ (not finished) |
2.2.2.2.1. Detailed Stats
Note: You can download these reports in HTML format
here
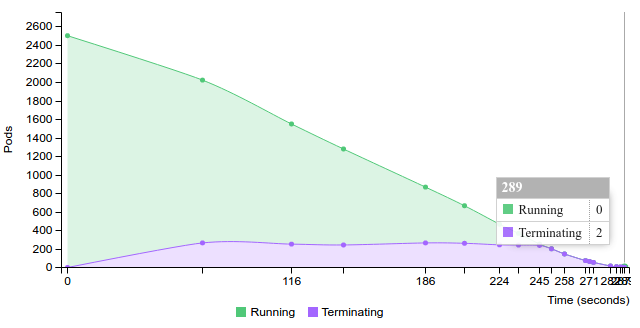
2.2.2.2.1.1. 50 pods (~1 pod per core) on 50 nodes
Start replication controller with 50 pods on 50 nodes
Terminate replication controller with 50 pods on 50 nodes
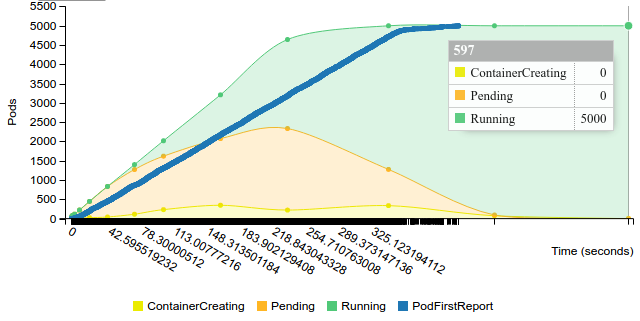
2.2.2.2.1.2. 100 pods (~2 pod per core) on 50 nodes
Start replication controller with 100 pods on 50 nodes
Terminate replication controller with 100 pods on 50 nodes
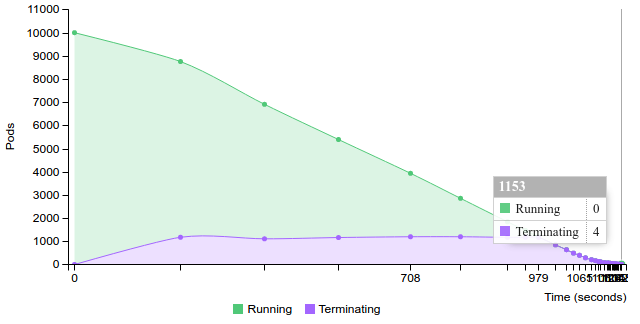
2.2.2.2.1.3. 200 pods (~4 pod per core) on 50 nodes
Start replication controller with 200 pods on 50 nodes

Terminate replication controller with 200 pods on 50 nodes
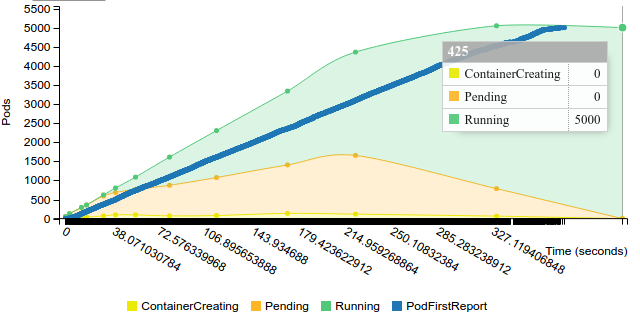
2.2.2.2.1.4. 50 pods (~1 pod per core) on 100 nodes
Start replication controller with 50 pods on 100 nodes
Terminate replication controller with 50 pods on 100 nodes
2.2.2.2.1.5. 100 pods (~2 pod per core) on 100 nodes
Start replication controller with 100 pods on 100 nodes
Terminate replication controller with 100 pods on 100 nodes
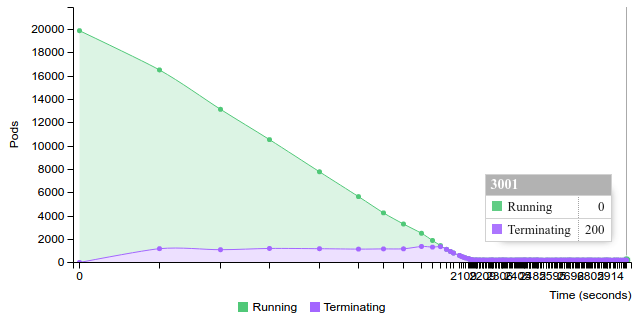
2.2.2.2.1.6. 200 pods (~4 pod per core) on 100 nodes
Start replication controller with 200 pods on 100 nodes
Terminate replication controller with 200 pods on 100 nodes
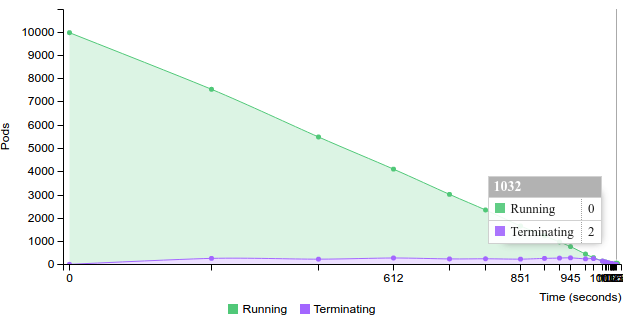
2.2.2.2.1.7. 50 pods (~1 pod per core) on 200 nodes
Start replication controller with 50 pods on 100 nodes
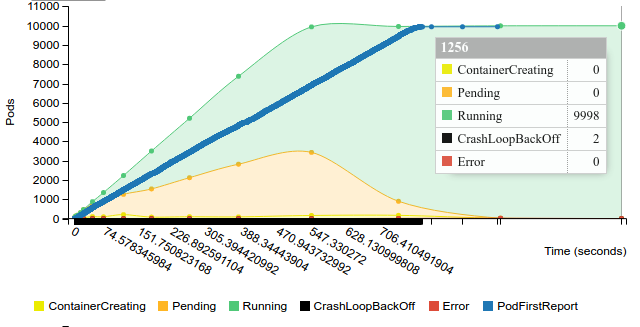
Terminate replication controller with 50 pods on 100 nodes
2.2.2.2.1.8. 100 pods (~2 pod per core) on 200 nodes
Start replication controller with 100 pods on 200 nodes
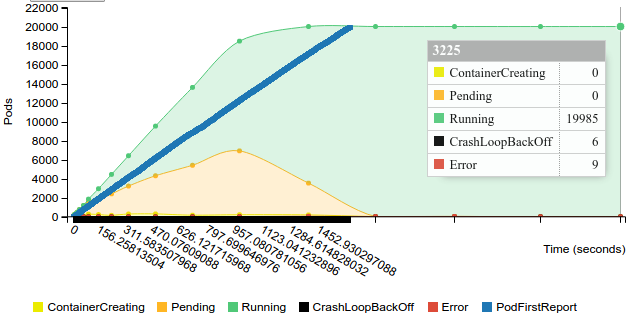
Terminate replication controller with 100 pods on 200 nodes
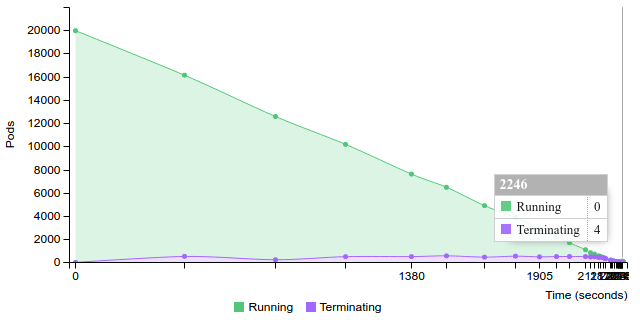
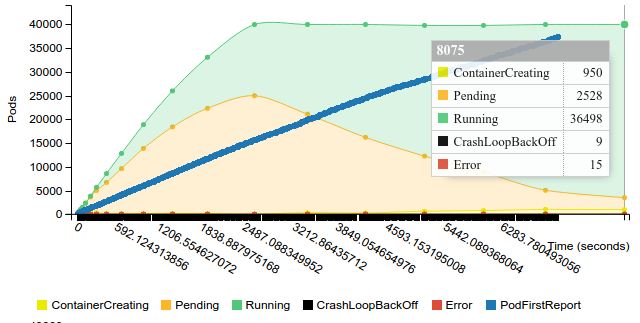
2.2.2.2.1.9. 200 pods (~4 pod per core) on 200 nodes
Start replication controller with 200 pods on 200 nodes
Note: Docker service is frozen on 27 nodes
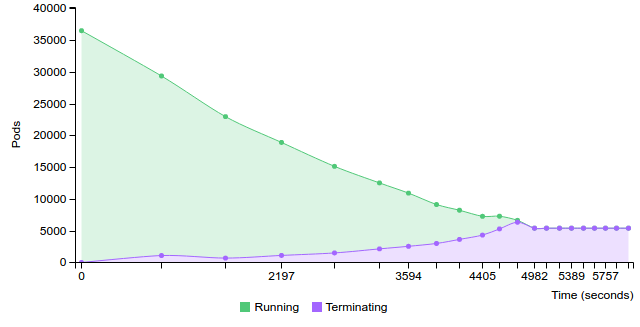
Terminate replication controller with 200 pods on 200 nodes
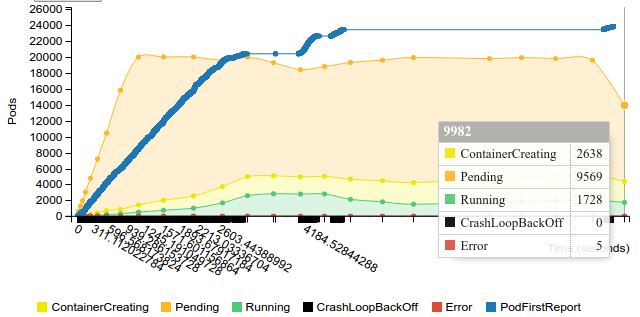
2.2.2.2.1.10. 400 pods (~8 pod per core) on 50 nodes
Start replication controller with 400 pods on 50 nodes
Terminate replication controller with 400 pods on 50 nodes